Progeny Simulation
simulates the progeny from a specified set of crosses scoring code. Scoring code is a predictive model saved into a SAS or JSL file. This process enables you to test various
models
to estimate the resulting outcomes.
Caution
: specifying a large number of crosses and/or progeny can consume considerable CPU and disk resources.
The
Input Data Set
must contain columns identifying the
genotypes
for each of the markers. Markers must be biallelic and defined using a numeric format.
Genotypes must be coded as 0, 1, 2, or dot (.) (for missing value) before this data set can be input into this process.
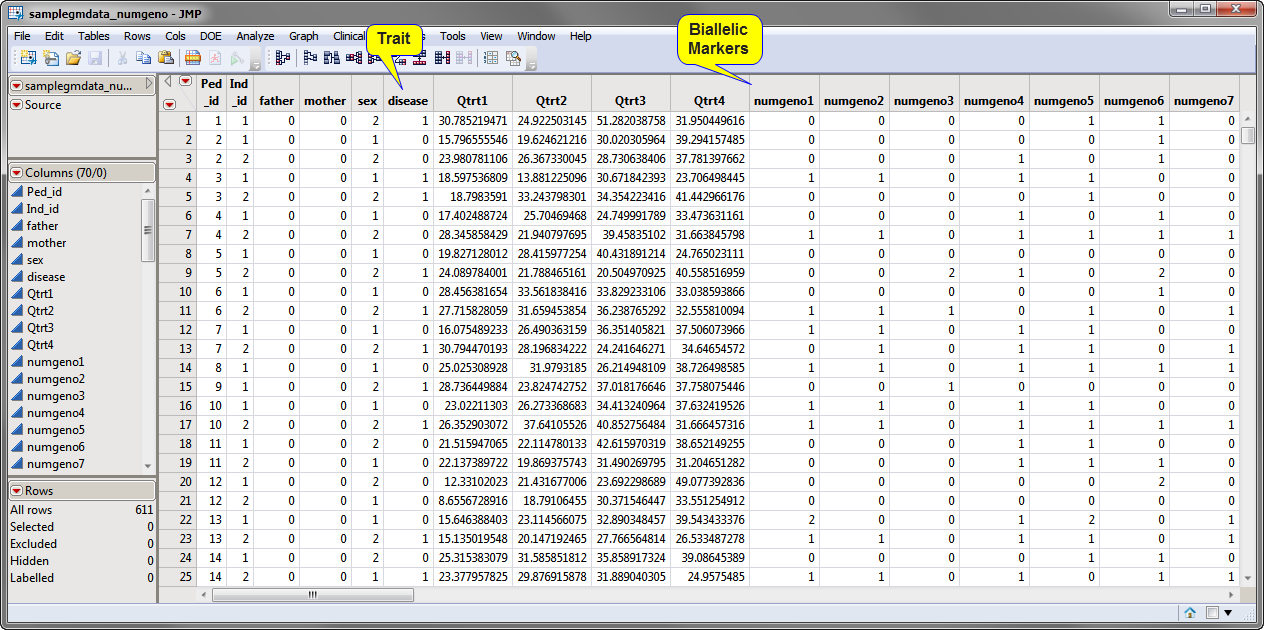
The
sampledata_numgeno.sas7bdat
data set shown above is included in the
Sample Data
folder. The
trait
to be assessed and the biallelic markers (
0
and
2
represent individuals
homozygous
for one of two possible
alleles
,
1
represents the heterozygote) are indicated.
For detailed information about the files and data sets used or created by JMP Life Sciences software, see
Files and Data Sets
.
A second, required, file is one or more
Scoring Code Files
. These files are SAS program files that contain models that use measured attributes to either characterize or predict the value of an event. These models are developed on historical data where an event has been measured or inferred and are generated using one or more predictive modeling processes, such as
Ridge Regression
, for example. The models are then applied to new data for which the attributes are known, but the event has not yet occurred.
The
sampledata_numgeno_rr_score.sas
file is shown below:
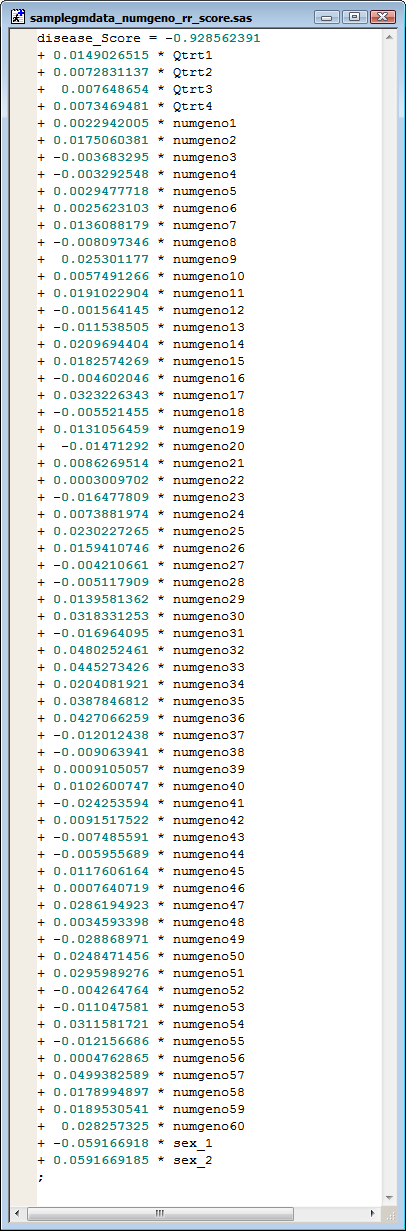
This file consists of one line of SAS code (spread over multiple lines in the file) that can be incorporated into a SAS DATA step in which the generated coefficients are multiplied by the
variables
to produce
predictors
for each cross.
The output generated by this process is summarized in a Tabbed report. Refer to the
Cross Evaluation
output documentation for detailed descriptions and guides to interpreting your results.