The
ProbF Trt
tab is shown below:
The
ProbF Trt
tab contains the following elements:
|
•
|
One or more
Volcano Plot
s showing the enrichment results from various tests.
|
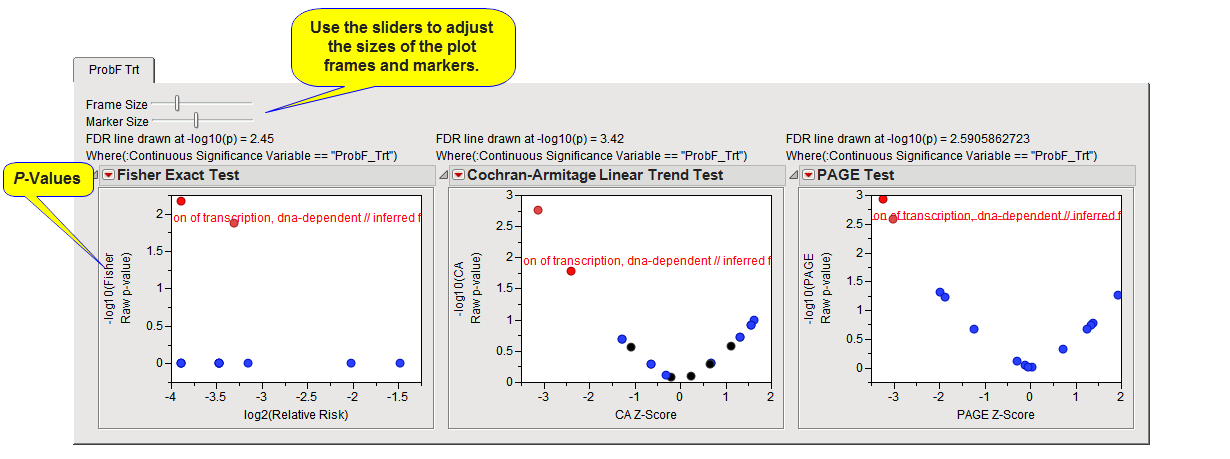
The plot above shows results for the Fisher Exact Test, the Cochran-Armitage Linear Trend Test, and the PAGE Test. The
x
-axis is a statistic specific to the test and the
y
-axis is the
-log
10
p-value
from the associated
F
test.
Points in red are significant according to the chosen multiple testing method. You can select significant points with the mouse and click one or more of the
Action Buttons
to view more specific details about those categories.