The
MA Plots
tab is shown below:
The
MA Plots
tab contains the following elements:
|
•
|
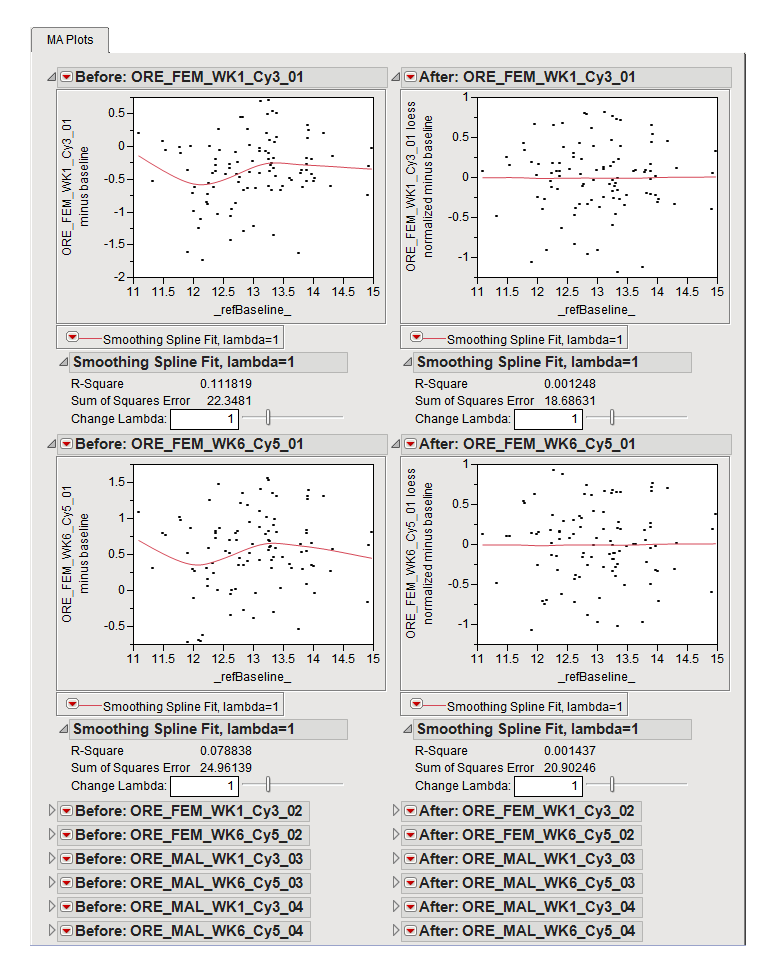
These plots are used to show whether
normalization
should be carried out prior to data analysis. In the example shown here, a pair of plots is generated for each column; plots on the left and right were generated before and after normalization, respectively. The red spline indicates the
mean
differences in
expression
.
A standard assumption in
microarray
experiments is that few genes should exhibit a change in expression, meaning that most points on the
y
axis
should be close to
zero
(0) and the spline should be relatively flat. The observed deviation in the splines in the raw data (
left
plots) was significantly reduced by the normalization performed here.