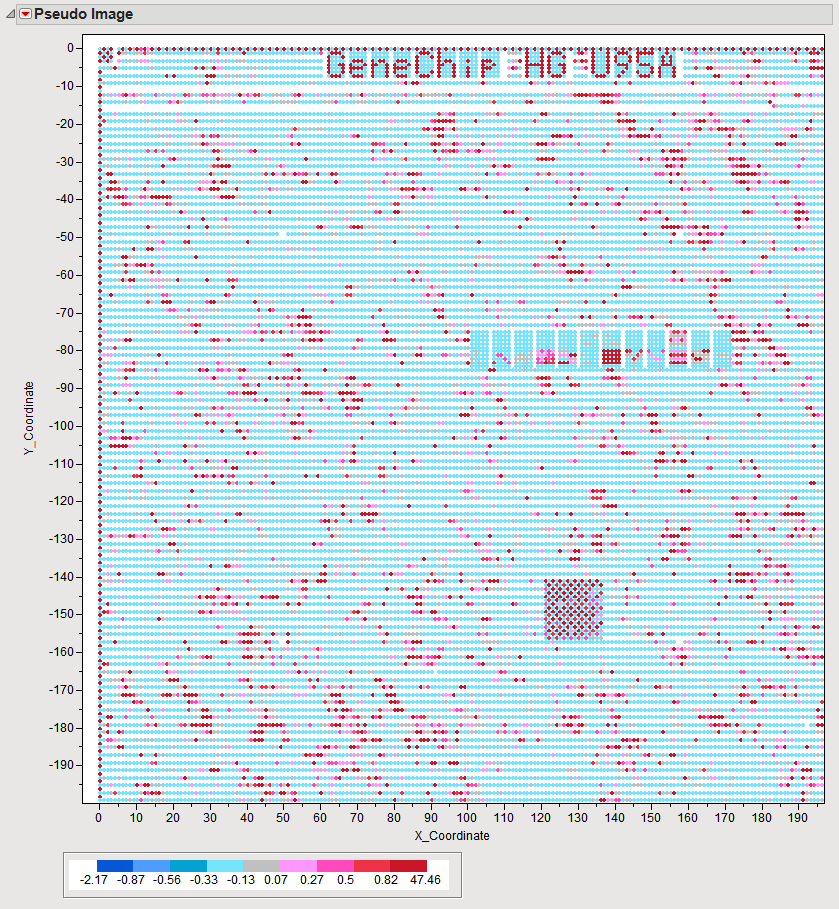
The
Pseudo Image
tab is shown below:
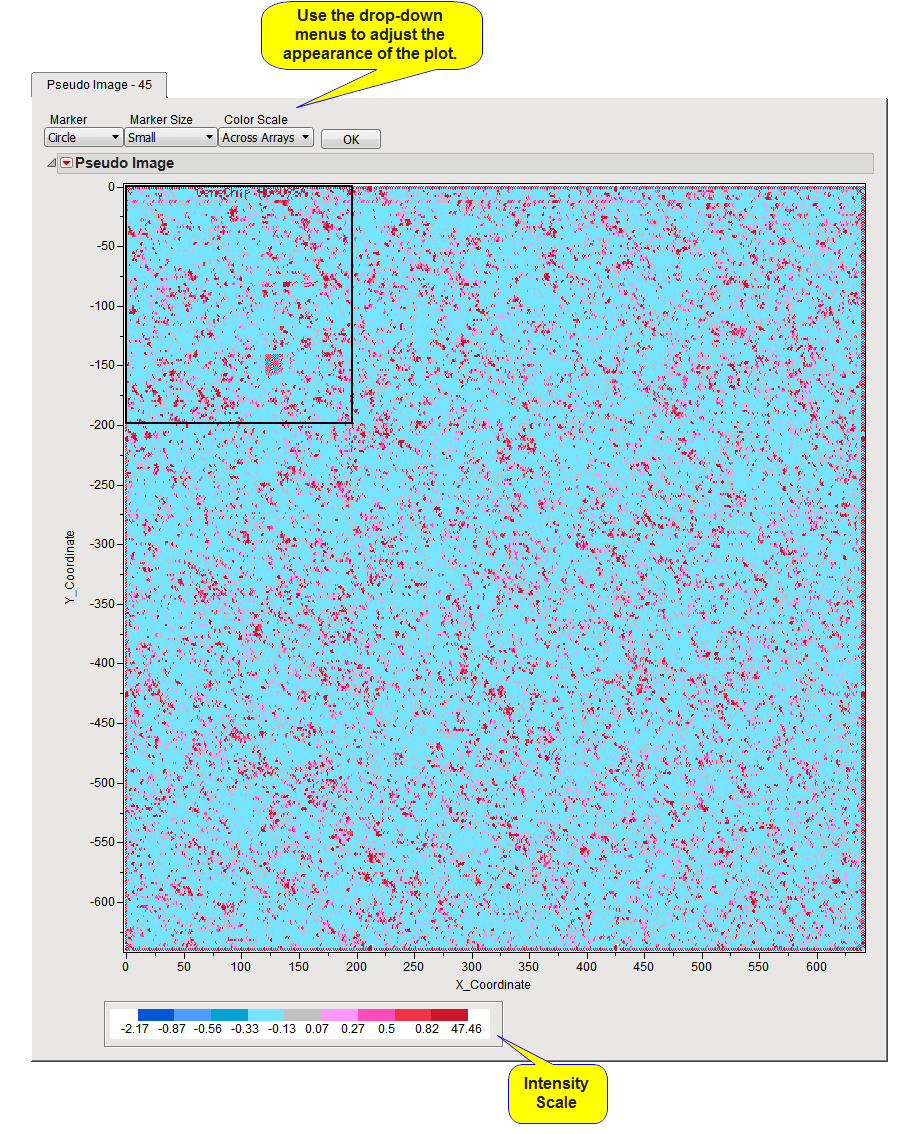
The
Pseudo Image
tab contains the following elements:
This plot represents a merge of information from both the input data set (
Response
) and coordinate data set (
X
- and
Y
-coordinates).
Note
: Graphs and their associated JMP tables are dynamically linked; selecting any feature on a graph highlights the corresponding row(s) in the associated table, and vice versa - thus, providing you with another way to filter the data.
Note
: The associated JMP tables can be accessed from the drop-down menus in the
Tabs
pane, by clicking
.