This tab displays the odds ratio
volcano plots
from all the annotation groups in a single display.
Note
: This tab is named
Trends Odds Ratio Plot
when either when no
Annotation Group Variable
is specified or when there is only one annotation group.
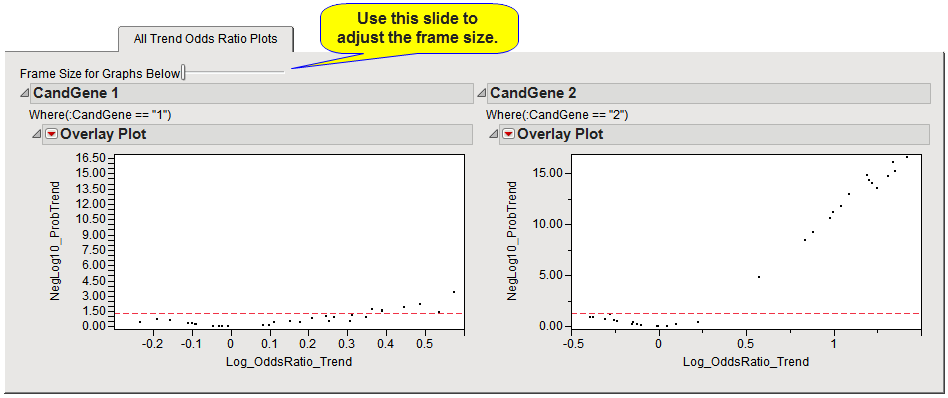
The
y
-axis
variable
of this scatter plot is the
p-value
from the
association
test, converted to the
-log
or
-log
10
scale if selected in the process
dialog
. The
x
-axis plots the
log
of the odds ratio for each marker. If the
log odds
are 0, then the odds ratio is 1 implying the odds of being affected with the disease (or whatever the
trait
variable represents) is the same for any number of
minor alleles
at that particular
SNP
. Values on the
x
-axis greater than 0 represent odds ratios greater than 1, and thus the odds of being affected increases with the number of minor alleles composing the
genotype
. The opposite is true for log odds less than 0. A horizontal reference line is drawn as a red, dashed line at the significance level that was specified. For
-log
- or
-log
10
-converted p-values, markers above this line are significant; for
p
-values on the original scale, markers below the line are significant.
Note
: Odds ratio volcano plots are generated only for
binary traits
and only when the
Calculate trend odds ratios
check box is checked.
See
Volcano Plot
for more information.