A separate
Annotation Group Results
tab is generated for each annotation group defined by the values of the
Annotation Group Variable
. Each tab is named for a specific group. There are two annotation groups (
CandGene1
and
CandGene2
) specified in the
samplegmdata
setting used in this example. The
CandGene1 Results
tab is shown below:
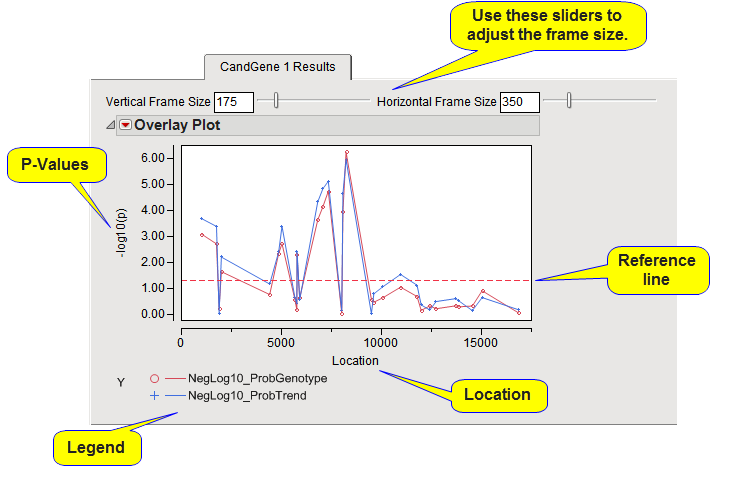
The
Annotation Group Results
tab contains the following elements:
|
•
|
One or more
P-Value Plots
.
|
In this
Overlay Plot
, the
Y
-axis
variable
is the
p-value
from the
association
tests, converted to the
-log
or
-log
10
scale if selected in the process
dialog
. The
X
-axis plots the location of the markers according to the annotation location variable within the annotation group. A horizontal reference line is drawn as a red, dashed line at the significance level that was specified. For
-log
- or
-log
10
-converted
p
-values, markers above this line are significant; for
p
-values on the original scale, markers below the line are significant. All tests are included in a single plot with a legend displaying the line and point color and marker for each test. If any
BY variables
were selected, a separate chart is displayed for each
BY group
.
|
•
|
One or more
Odds Ratio Volcano Plots
.
|
When the
trait
is binary and the
Calculate trend odds ratios
check box has been checked, each Annotation Group Results tab also contains an odds ratio
volcano plot
.
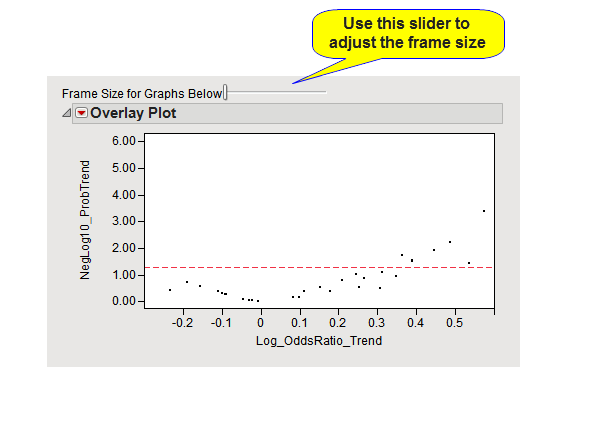
The
y
-axis variable of this scatter plot is the
p
-value from the association test, converted to the
-log
or
-log
10
scale if selected in the process dialog. The
x
-axis plots the
log
of the odds ratio for each marker. If the
log odds
are 0, then the odds ratio is 1 implying the odds of being affected with the disease (or whatever the trait variable represents) is the same for any number of
minor allele
at that particular
SNP
. Values on the
x
-axis greater than 0 represent odds ratios greater than 1, and thus the odds of being affected increases with the number of minor alleles composing the
genotype
. The opposite is true for log odds less than 0. A horizontal reference line is drawn as a red, dashed line at the significance level that was specified. For
-log
- or
-log
10
-converted p-values, markers above this line are significant; for
p
-values on the original scale, markers below the line are significant.
Note
: For the
SNP-Trait Association
process, odds ratio volcano plots are generated only for
binary traits
and only when the
Calculate trend odds ratios
check box is checked.
Note
: For the
Haplotype Estimation
process, there is a point for each marker window instead of for each marker.