A portion of the
Annotation Group Results
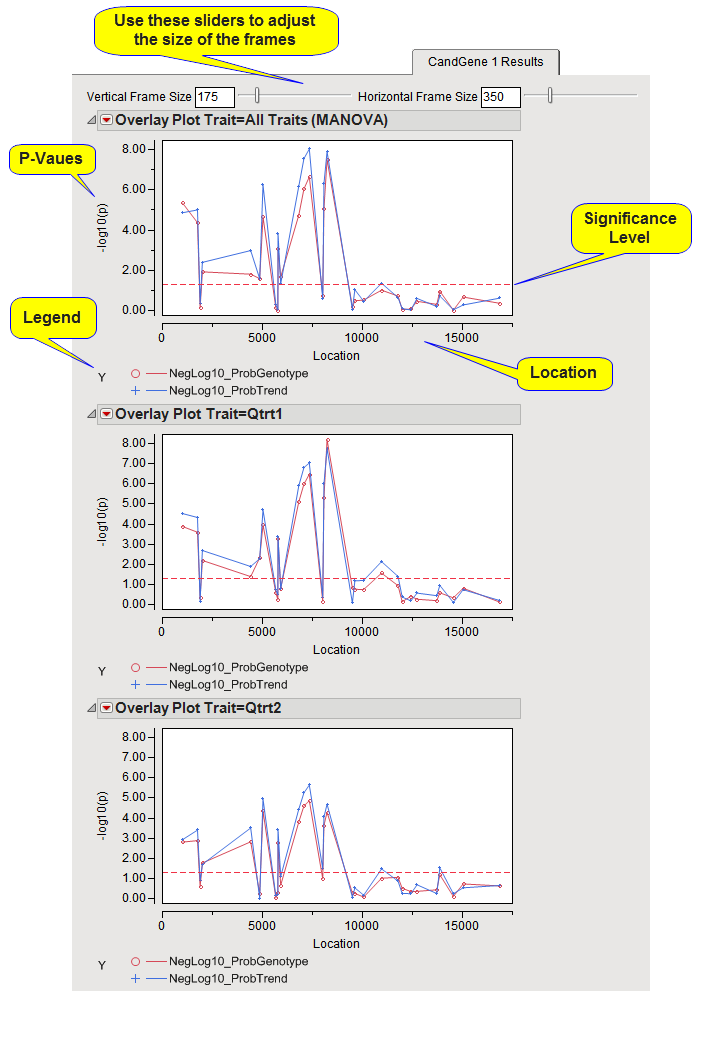
tab is shown below:
The
Annotation Group Results
tab contains the following elements:
|
•
|
A set of
P
-Value Plots.
|
When there are multiple annotation groups, there is a separate
Annotation Group Results
tab for each annotation group. In this example there are two annotation groups,
CandGene 1
and
CandGene 2
. The
CandGene 1 Results
tab is shown above.
The
y
-axis
variable
is the
p-value
from the
association
tests, converted to the
-log
or
-log
10
scale if selected in the process
dialog
. The
x
-axis plots location of the marker according to the annotation location variable within the annotation group. A horizontal reference line is drawn as a red, dashed line at the significance level that was specified. For
-log
- or
-log
10
-converted
p
-values, markers above this line are significant; for
p
-values on the original scale, markers below the line are significant.