The
Overlay Plots
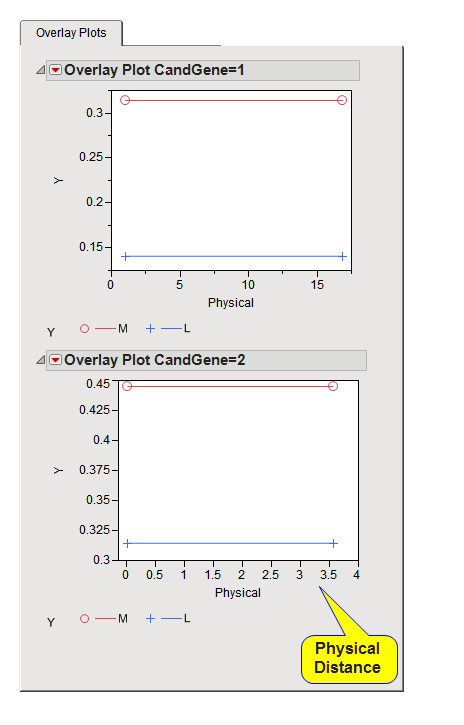
tab is shown below:
The
Overlay Plots
tab contains the following elements:
|
•
|
The
M
and
L
parameter estimates
1
are used, along with
an estimate of the LD measure
Rho
(calculated using the
Linkage Disequilibrium
analytical procedure
) to fit the Malecot model
Rho = (1-L)*M*exp(-E_i*d_i)+L
to each interval of length
d_i
kb between consecutive
SNPs
via nonlinear optimization routines. Distances between pairs of SNPs can then be represented in terms of
LD units
(LDU), which are computed by summing (
E_i*d_i
) over all intervals between the pair of SNPs, and are shown on the
Bivariate Plots (Malecot LD Map)
tab.
M
represents the youngest
haplotype
that is
monophyletic
.
L
represents the bias that occurs over large distances. See
Maniatis
et al
. (2002)
for more details.