The
P-Value Plot Global
tab is shown below:
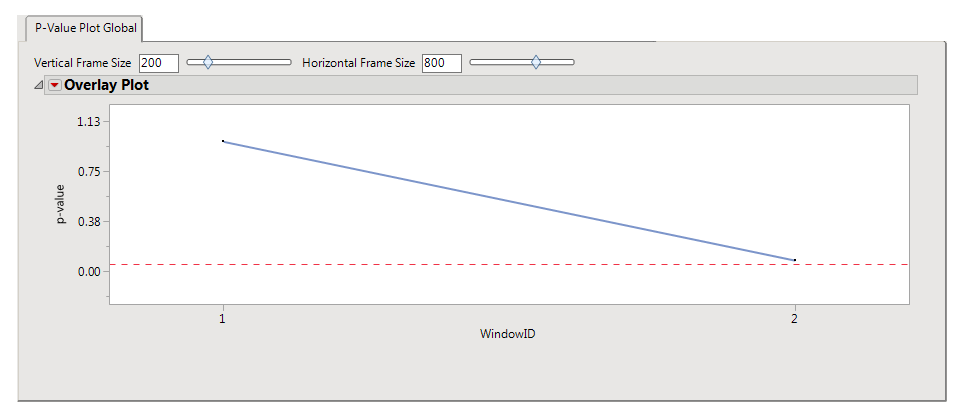
Smaller values of
p
-values indicate stronger association between the tested haplotypes tested altogether in the global model and the trait.