A
Plots of Runs (Chromosome)
tab is shown below:
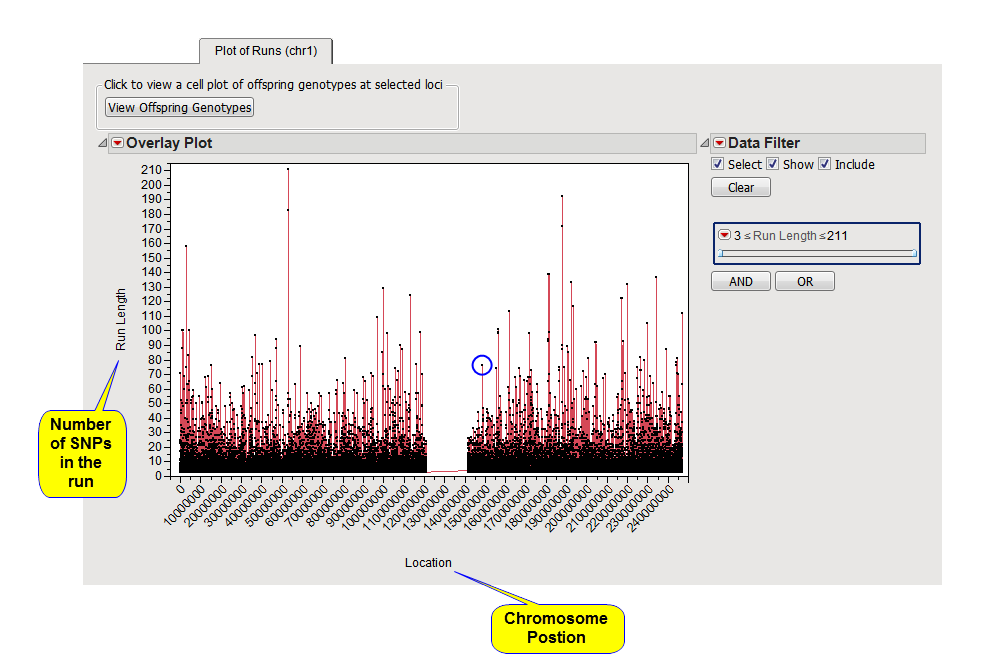
The Plots of Runs (Chromosome) tab is created for each value of the Chromosome
variable
selected in the process
dialog
and contains the following elements:
The
y
-axis of this plot represents the Run Length for each run and the
x
-axis has the
chromosome
location. If you zoom in far enough (using JMPs
 tool), you can see what looks like a point on the plot is actually made up of points for each
SNP
included in the run all with the same
y
-axis value. This number of points is the same as the Run Length.
tool), you can see what looks like a point on the plot is actually made up of points for each
SNP
included in the run all with the same
y
-axis value. This number of points is the same as the Run Length.
The
Data Filter
on the right can be used to restrict the display to run lengths in a certain range.
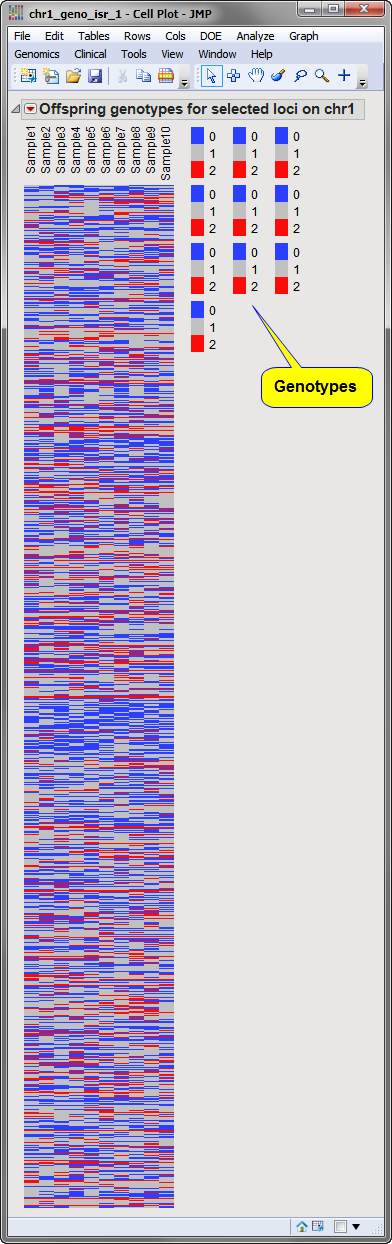
You can select a run or individual SNP points then click on the
button to bring up a
cell plot
view of the offspring
genotypes
at the selected SNPs. An example of this plot (for the run circled in the figure above) is shown below: