The
Summary Chart
tab (shown below) gives an overview of the counts of significant markers for the HWE test in each annotation group.
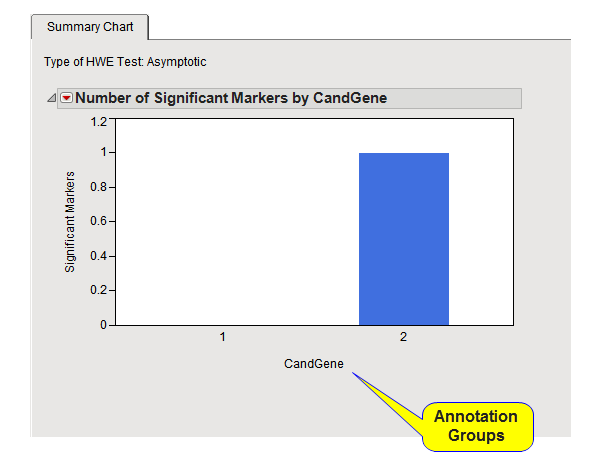
The Summary Chart tab (shown below) gives an overview of the counts of significant markers for the HWE test in each annotation group.