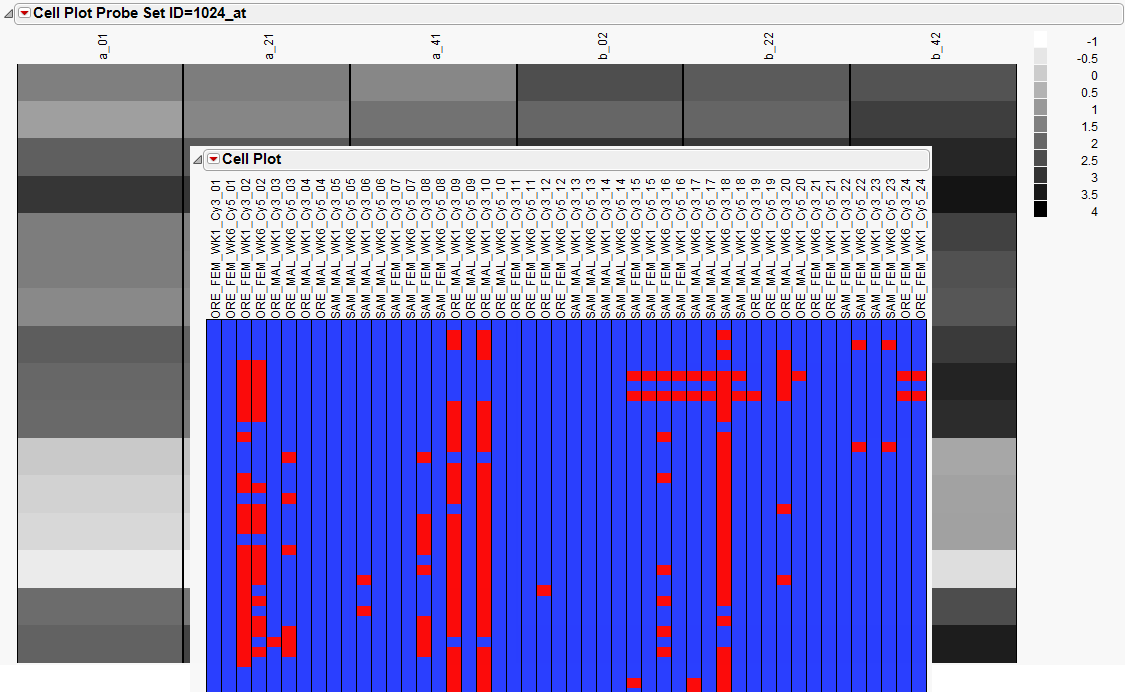
A
cell plot
(also known as a heat map or color map display) maps colors to values of
variables
, and displays them in a rectangular grid.
|
•
|
The
black-and-white
cell plot indicates spectral intensity data (generated from
Spectral 2D Plot
), with darker regions indicating higher intensities.
|
|
•
|
The
red-and-blue
plot was generated from
Feature Flagger
. Array features with abnormally low signal (
red
) have been identified.
|