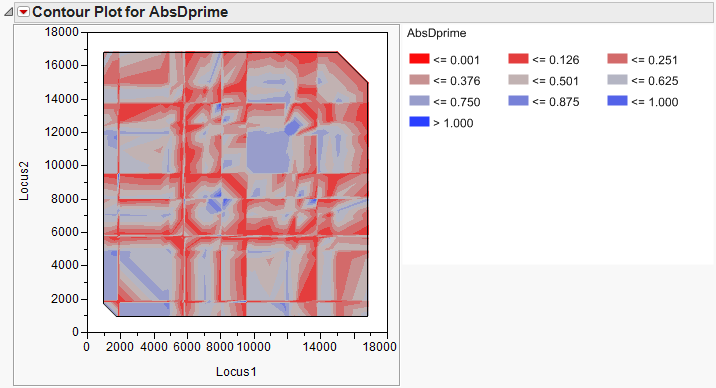
A map of contour lines or shading showing the gradient of value change across two dimensions. The example below shows
AbsDprime
values (shaded similarly as a topographic map) by
Locus1
and
Locus2
position.