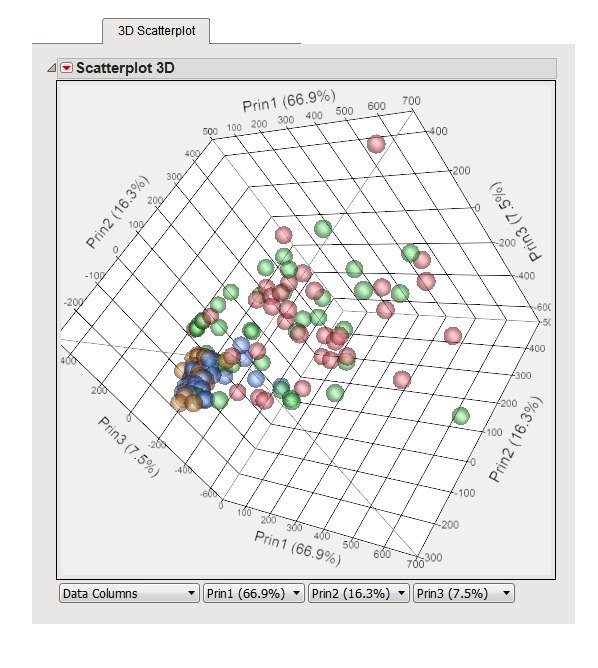
Output | Predictive Modeling | 3D Scatterplot

3D Scatterplot
The 3D Scatterplot tab is shown below:
The 3D Scatterplot tab contains the following elements:
This is a plot of the scores from the first three dimensions. Use the mouse to rotate the plot or select points. If you have computed scores for more than three dimensions, you can select scores from the fourth or higher dimensions using the pull-down menu at the top of the plot.
Use this plot to look for patterns in the scores, again verifying that those from the secondary data set fall within the range of those from the primary data set.