The
Model Effects
tab contains the following elements:
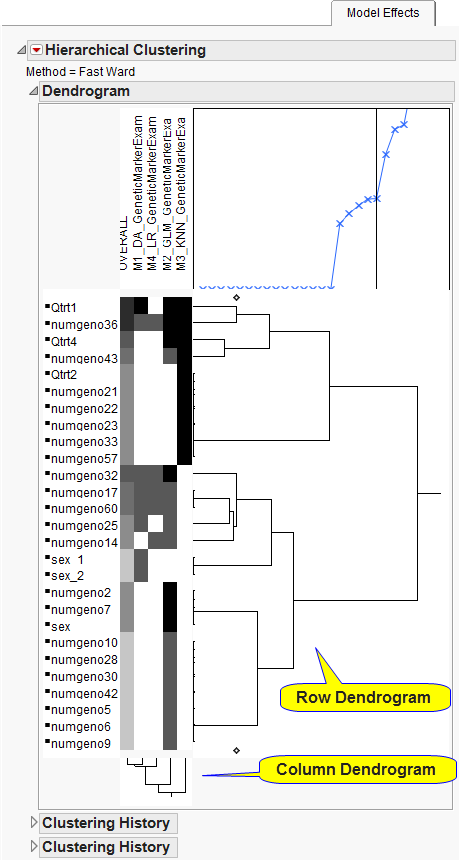
This analysis clusters the frequency of occurrence of each individual
predictor
across the CVMC iterations of all of the methods as well as an overall frequency. Predictors occurring at the
top
of the display occur most frequently and are likely the best predictors for the response. Study the
Heat Map and Dendrogram
to see which methods chose which predictors most frequently.
Darker
shades of gray indicate
higher
frequencies. The
column
dendrogram
reveals which method behaved similarly in terms of choosing predictors. The
row dendrogram
reveals which predictors entered methods with similar frequencies.
See
Hierarchical Clustering
for more information.