Running this process for the AffymetrixLatinSquareExample sample setting generates the tabbed Results window shown below. Refer to the Pseudo Image process description for more information. Output from the process is organized into tabs. Each tab contains one or more plots, data panels, data filters, and so on, that facilitate your analysis.
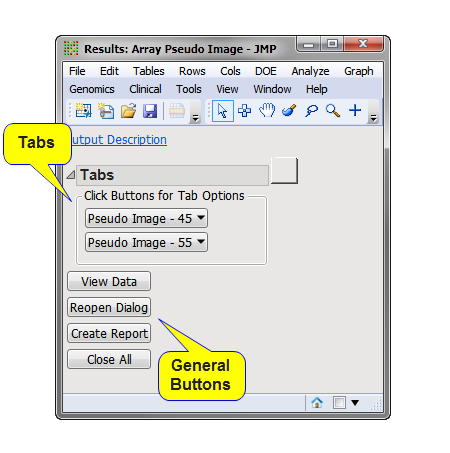
The Results window contains the following panes:
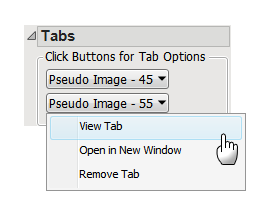
This pane enables you to access and view the output plots and associated data sets on each tab. Use the drop-down menu to view the tab in the Tab Viewer pane, open the tab in a new window, remove the tab and its contents from the Tab Viewer pane, or open the output data set(s) used to generate the plots and charts illustrated on the tab.
|
•
|
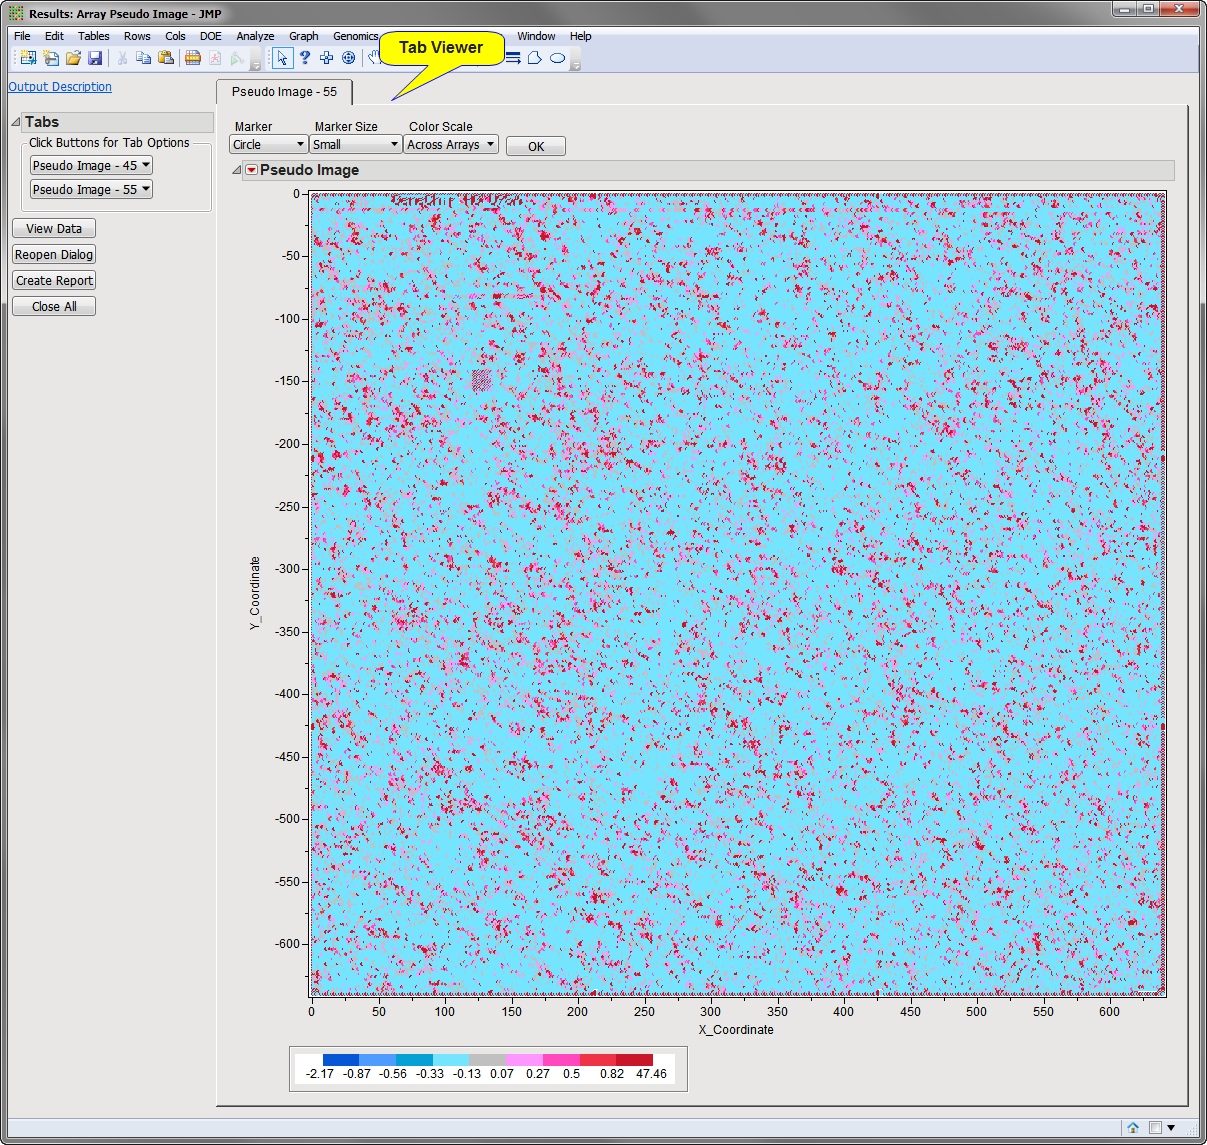
Pseudo Image: This tab shows the interactive surface plots. There is one tab for each variable specified in the Array Variables to Plot field.
|
|
|
Left-click on to view the PseudoImage in the Tab Viewer pane.
|
|
•
|
Click to surface the data sets corresponding to the active tab.
|
|
•
|
Click Reopen Dialog to reopen the completed process dialog used to generate this output.
|
|
•
|
Click Create Report to generate a pdf- or rtf-formatted report containing the plots and charts of selected tabs.
|
|
•
|
Click Close All to close all graphics windows and underlying data sets associated with the output.
|