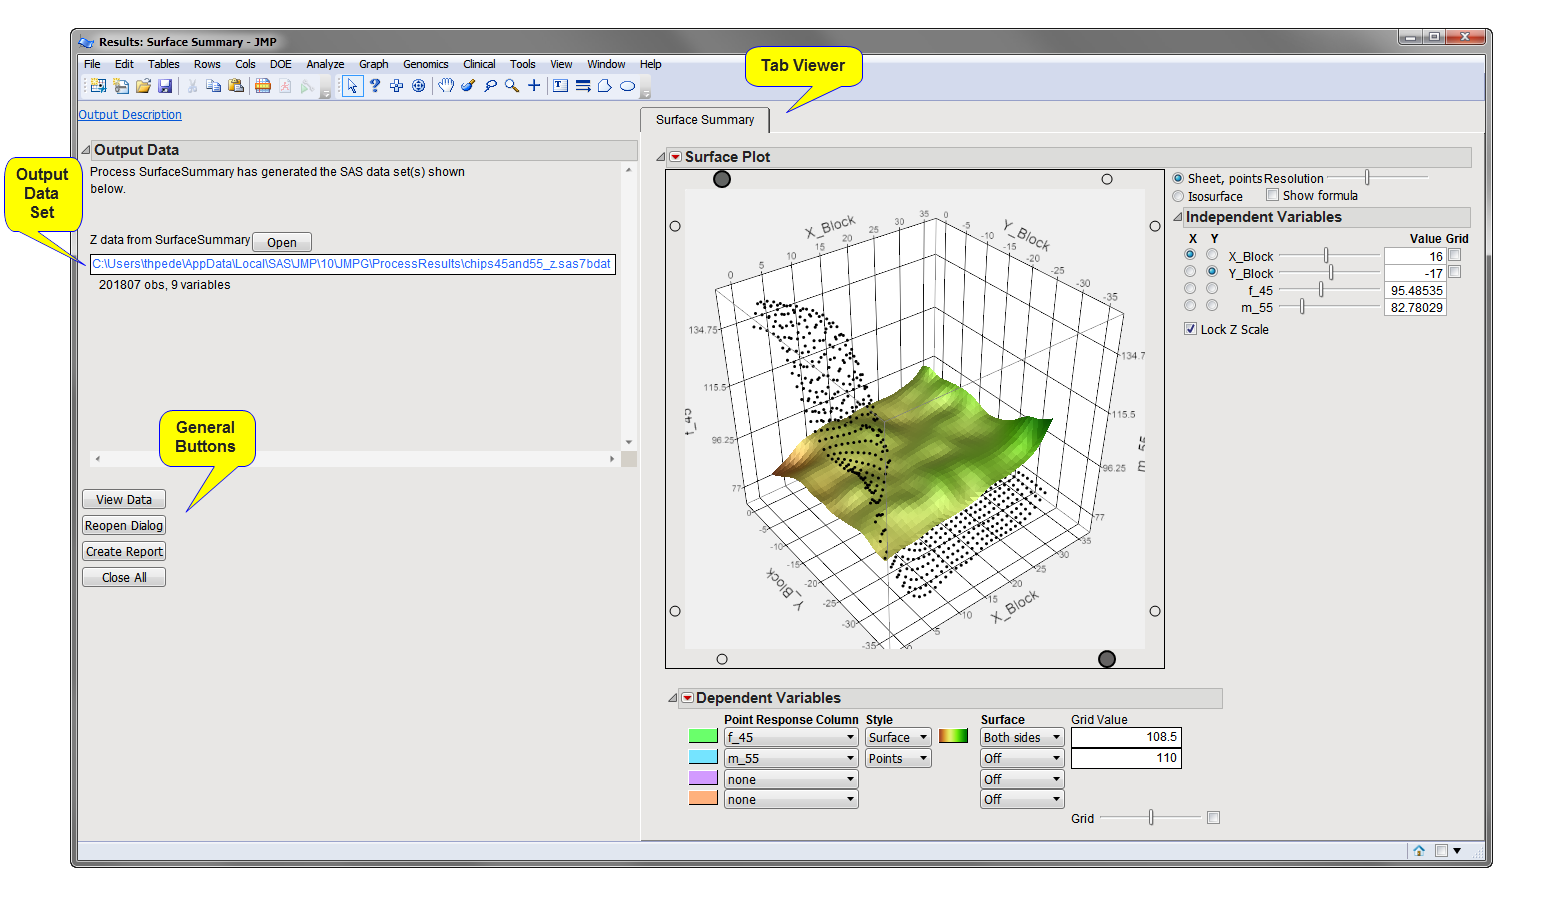
Running this process for the AffymetrixLatinSquareExample sample setting generates the tabbed Results window shown below. Refer to the Surface Summary process description for more information. Output from the process is organized into tabs. Each tab contains one or more plots, data panels, data filters, and so on, that facilitate your analysis.
The Results window contains the following panes:
This pane provides you with a space to view individual tabs within the Results window. Use the tabs to access and view the output plots and associated data sets.
|
•
|
Surface Summary: This tab shows the interactive surface plots.
|
|
•
|
Output Z Data Set: This data set contains the x- and y-coordinates from the input coordinates data set and the intensity values from the input z data set
|
|
•
|
Click to surface the data sets corresponding to the active tab.
|
|
•
|
Click to reopen the completed process dialog used to generate this output.
|
|
•
|
Click Create Report to generate a pdf- or rtf-formatted report containing the plots and charts of selected tabs.
|
|
•
|
Click Close All to close all graphics windows and underlying data sets associated with the output.
|
In addition to the tabbed Results window, a .pdf file containing static, full color representations of the plots (shown below) is generated.
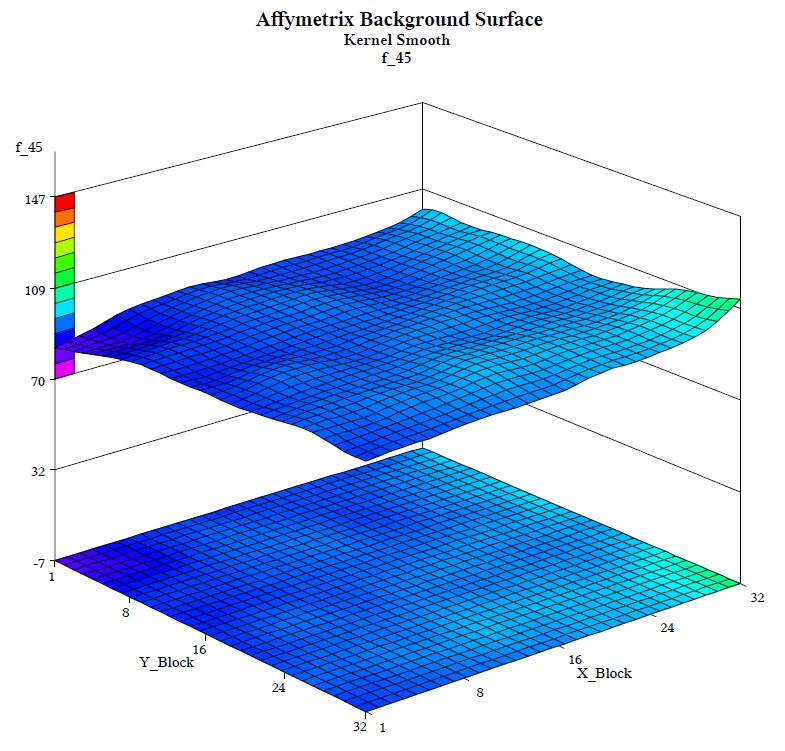
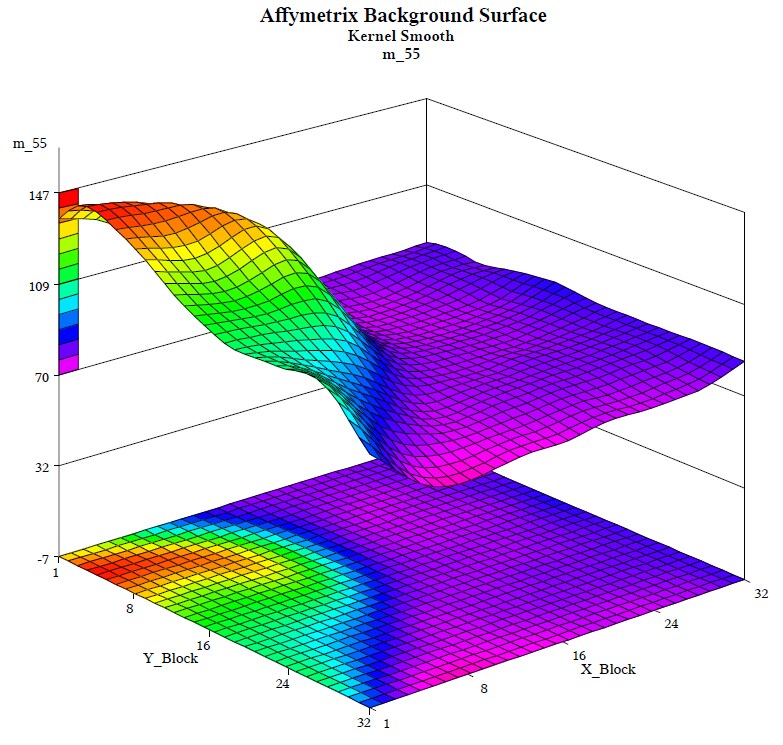
Examination of the plots reveals that while the background of chip f_45 is relatively smooth, chip m_55 has a region of unusually high background signal.