Running this process for the ProstateCancerExample sample setting generates one filtered output data set accessed from a Results window shown below. Refer to the Survival Analysis process description for more information about this process.
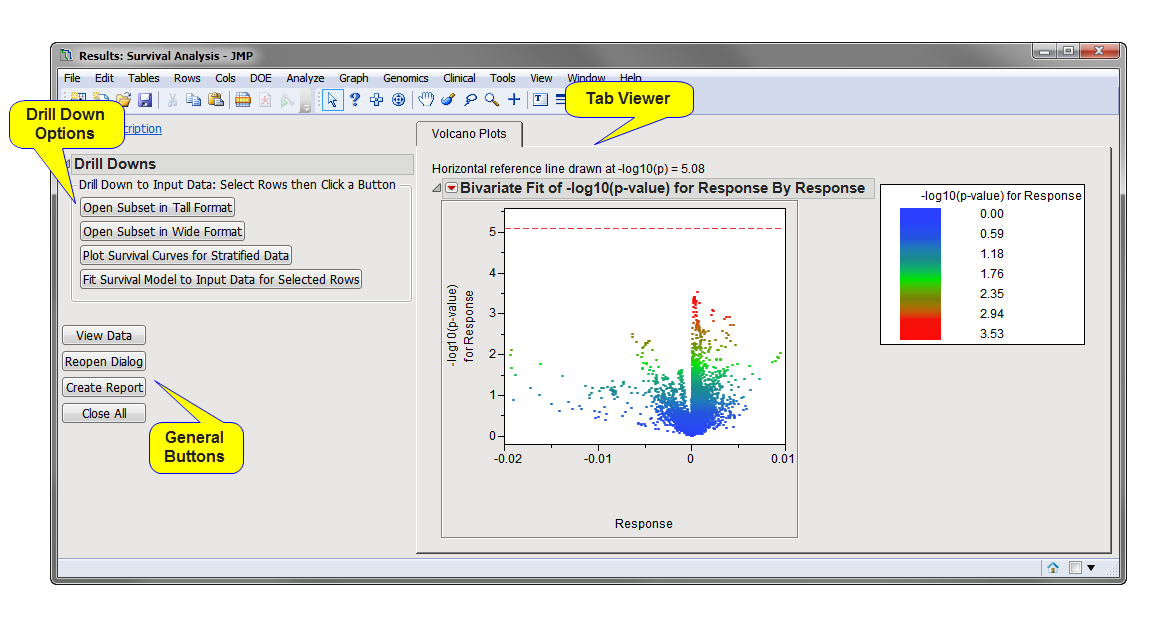
The Results window contains the following panes:
This pane provides you with a space to view individual tabs within the Results window. Use the tabs to access and view the output plots and associated data sets.
|
•
|
The output data set (identified by the appended _sva suffix) corresponding to this plot can be accessed by selecting .
|
•
|
Chromosome Position Plots: This tab shows a separate overlay plot for each chromosome of the meta-analysis p-value by chromosome location for the markers This tab is generated whenever a Chromosome Variable is specified.
|
|
•
|
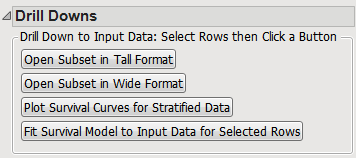
Open Subset in Tall Format: Select points or rows and click to create a tall version of the input data for the selected features.
|
|
•
|
Open Subset in Wide Format: Select points or rows and click to create a wide version of the input data for the selected features.
|
|
•
|
Plot Survival Curves for Stratified Data: Select points from the volcano plot or rows from the output data table and click to plot Survival Curves for the specified groups.
|
|
•
|
Fit Survival Model to Input Data for Selected Rows: Select points from the volcano plot or rows from the output data table and click to generate a wide subset data set consisting of the selected rows and a Survival Plot with associated test statistics for the subset data set.
|
|
•
|
Click to surface the data sets corresponding to the active tab.
|
|
•
|
Click to reopen the completed process dialog used to generate this output.
|
|
•
|
Click Create Report to generate a pdf- or rtf-formatted report containing the plots and charts of selected tabs.
|
|
•
|
Click to close all graphics windows and underlying data sets associated with the output.
|