The Two-Way Plotter uses SAS/GRAPH to produce both line plots and bar charts showing gene expression under two potentially interacting experimental design variables and displays them in a .pdf file (shown below). The plots are useful for studying data in detail and deciphering potential interaction effects between the two plotting variables. Refer to Two-Way Plotter for an overview of the process.
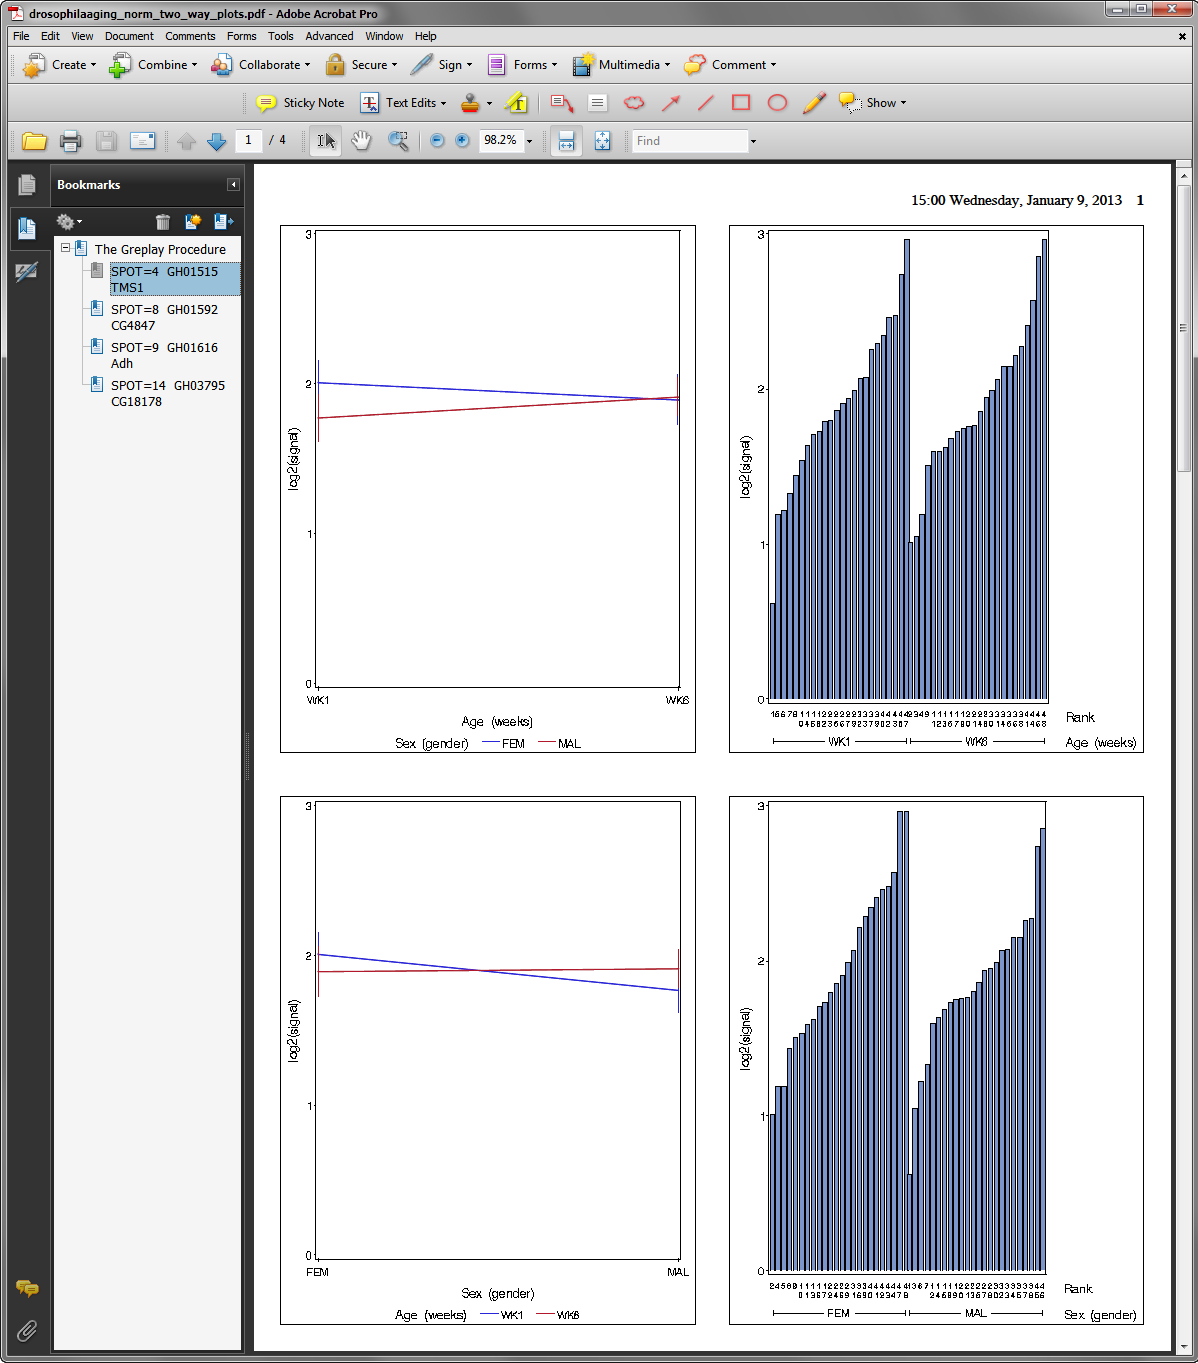
Running this process using the DrosophilaAgingExample sample setting generates a PDF showing the effect of age and sex on the expression of a set of four Drosophila genes. Two pairs of plots, one pair for each plotting variable, are generated for each value of the ID Variable that you specified. In each pair, the plot on the left is a line plot of mean values across the first plotting variable, and the plot on the right is a bar chart with values sorted by values of the first variable and then by rank within each value.
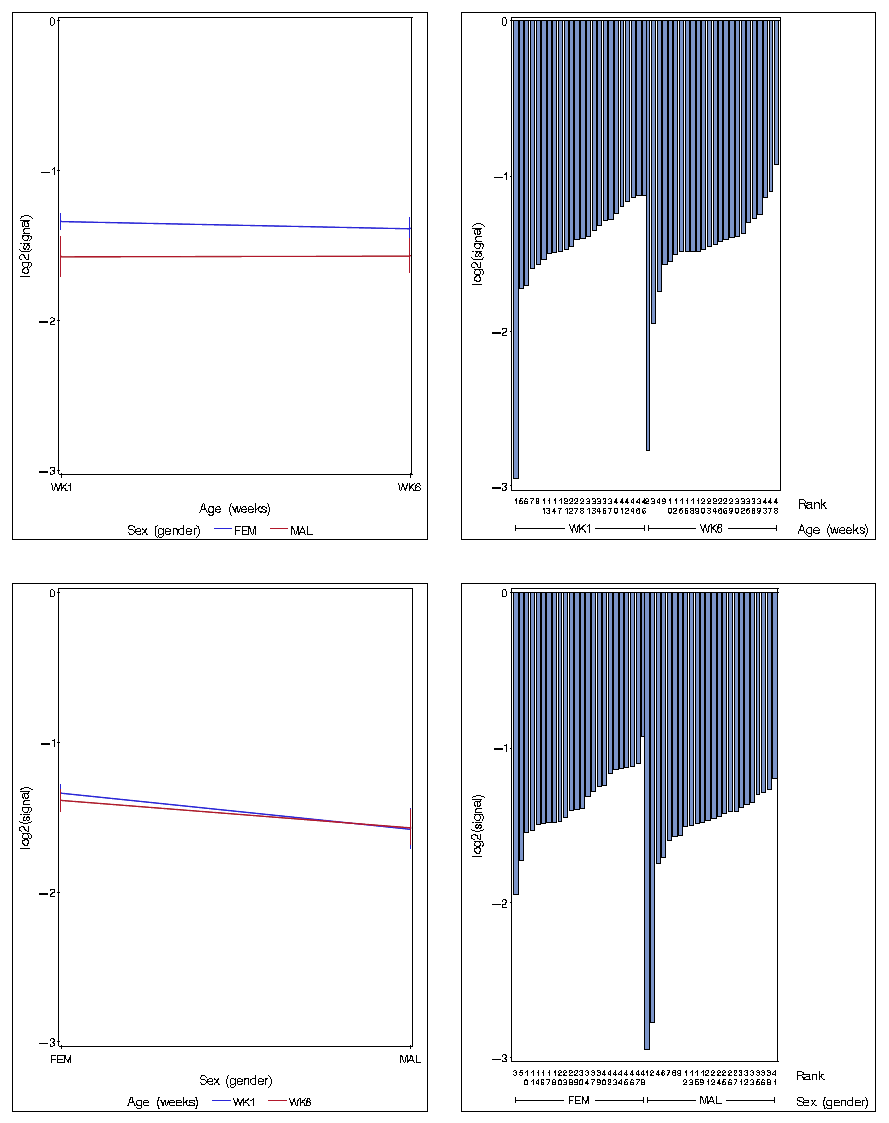
Examination of the plots for the Drosophila CG18178 gene shows that there is little difference in the expression of this gene between males and females, and this is consistent for flies of different ages, as indicated by the parallel slopes of the line plots, below. These observations indicate a lack of interaction between age and sex for this particular gene. The similar shapes of the sorted gene profiles on the right hand side also confirm no interaction.
Examination of the plots for the Drosophila CG4847 (cysteine protease) gene, however, shows that the slopes of the line plots are different under each condition, as shown below. Furthermore, the patterns seen in the bar charts to the right are different between the two conditions. These results suggest an interaction between age and sex in the expression of this gene.
