Running this process for the StudyExample sample setting generates the tabbed Results window shown below. Refer to the Meta-Analysis process description for more information. Output from the process is organized into tabs. Each tab contains one or more plots, data panels, data filters, and so on. that facilitate your analysis.
The Results window contains the following panes:
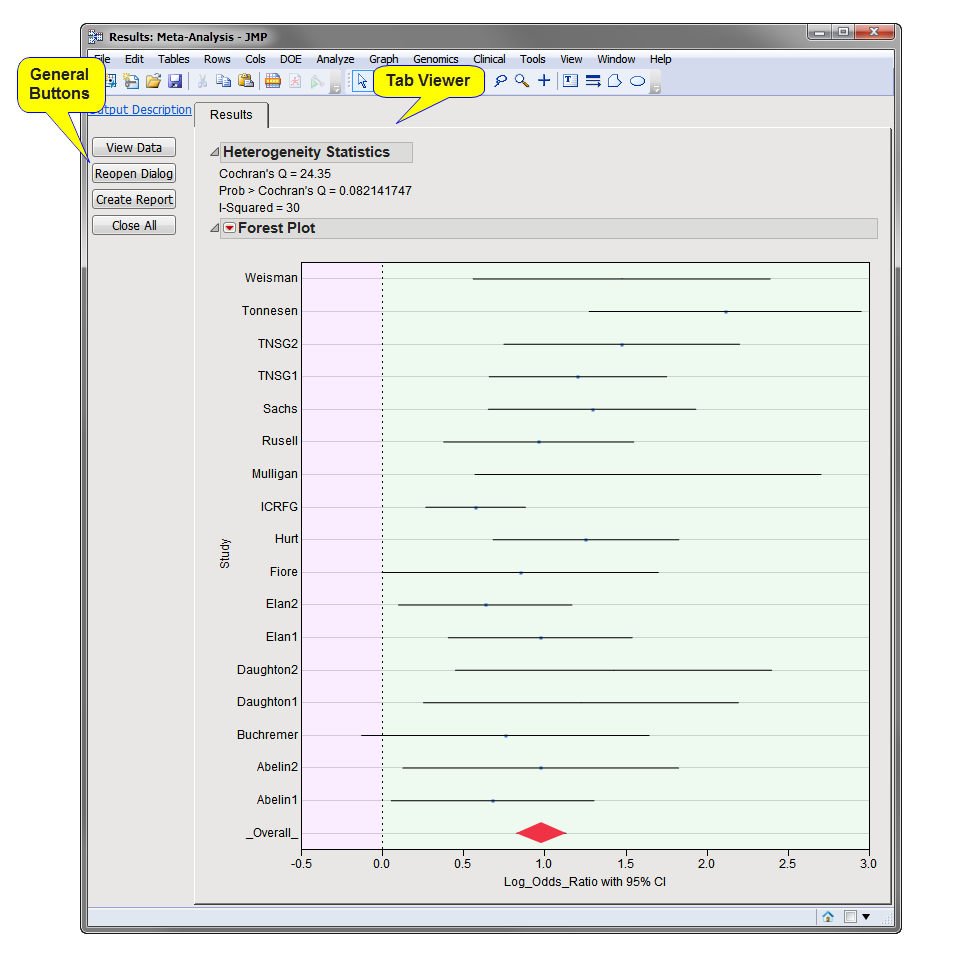
This pane provides you with a space to view individual tabs within the Results window. Use the tabs to access and view the output plots and associated data sets.
|
•
|
Results: This tab is created and displays the heterogeneity statistics at the top of the tab with a forest plot below when no Effect ID Variable is specified.
|
|
•
|
Heterogeneity Statistics: This tab displays the distribution of the heterogeneity statistics Cochran's Q, the p-value for Cochran's Q, and I2 across all markers. This tab is generated when either inverse variance method for combining p-values has been selected using the Method to Use parameter and an Effect ID Variable is specified.
|
|
•
|
Volcano Plot(s): This tab displays a scatter plot of overall p-value by overall effect estimate and is generated when an Effect ID Variable is specified.
|
|
•
|
Forest Plot: Click this button to view forest plots for selected from either the Heterogeneity Statistics or Volcano Plot(s) tabs.
|
This button is surfaced when either inverse variance method for combining p-values has been selected using the Method to Use parameter and an Effect ID Variable has been specified.
|
•
|
P-Value Data Set: This data set displays the p-values from each study along with the overall meta-analysis p-value calculated. It is generated when the P-values weighted by square root of sample size method has been selected from the process dialog using the Method to Use parameter, this data set displays the p-values from each study along with the overall meta-analysis p-value calculated. If an Effect ID Variable was selected, there is a row in this data set for each effect. Click to view the data set.
|
For detailed information about the files and data sets used or created by JMP Life Sciences software, see Files and Data Sets.
|
•
|
Click to reveal the underlying data table associated with the current tab.
|
|
•
|
Click to reopen the completed process dialog used to generate this output.
|
|
•
|
|
•
|
Click to close all graphics windows and underlying data sets associated with the output.
|