P-Value Adjustment
Smoothing methods can be applied that take into account p-values from neighboring, and possibly correlated, markers. That is, the peak length can be used to indicate significance in addition to the peak height.
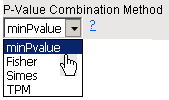
This smoothing can be performed using the Fisher, Simes, or truncated product method (TPM) on sliding windows of markers, as described in the table below:
|
|||||
|
|||||
Note: This method is equivalent to Fisher’s method when tau=1.
|
|||||
|
Zaykin, D.V., Zhivotovsky, L.A., Westfall, P.H., and Weir, B.S. (2002). Truncated Product Method for Combining p-Values. Genetic Epidemiology 22: 170–185.
To Specify a P-Value Adjustment Method:
For more information about these methods, see the Methods of Smoothing p-Values in the SAS/Genetics User's Guide.