Before we examine the generation of JSL code for the Distribution Analysis process (code name DataDistribution), let’s first examine the process.
|
|
Select Genomics > Expression > Quality Control > Distribution Analysis.
|
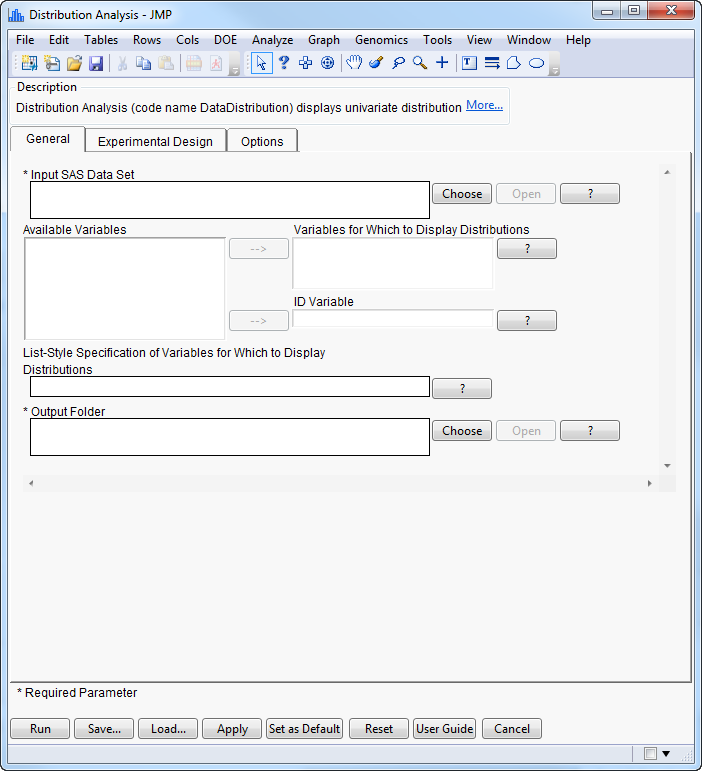
Distribution Analysis performs univariate distribution analyses on a set of variables in a SAS data set and constructs corresponding graphics.
|
|
Click .
|
|
|
Select DrosophilaAgingExample and click .
|

The drosophilaaging_norm.sas7bdat file has been chosen as the input data set. Data in this file have been normalized. Distributions are to be drawn for all of the variables.
|
|
Click .
|
Graphical output of the Distribution Analysis process includes box plots, distributions, and parallel plots showing overlaid kernal estimates (below) for each of the specified variables.

All of the output graphics are generated automatically by a JMP script that was created in the SAS code and then launched in JMP after the SAS code completed processing. The JSL code for this example was saved in the ProcessResults folder (as specified in the Distribution Analysis dialog). The output .jsl file was named DataDistribution Script for drosophilaaging_norm.jsl.
|
|
Navigate to the ProcessResults folder.
|
|
|
Open the DataDistribution Script for drosophilaaging_norm.jsl file using a text editor.
|
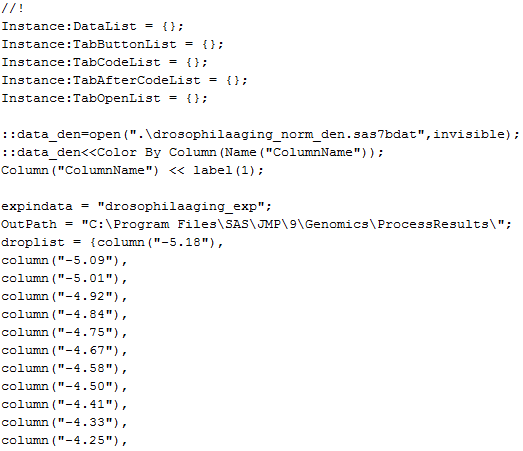
The first part of the JSL script should appear mas shown below.
|
|
Examine the JSL script.
|
The first line of JSL code, //!, instructs JMP to automatically run the script. The five instance statements prepare the tabbed output: a list of SAS data sets (DataList), a series of buttons (TabButtonList), the corresponding JSL code for each of the tab buttons (TabCodeList and TabAfterCodeList), and the setting for whether results are actually displayed (TabOpenList). The next three lines (starting with ::data_den) open the output drosophilaagaing_norm_densities.sas7bdat file (into a JMP table) necessary for generating the graph in the results window, and sets color and Label variables. The line beginning with “expindata” designates the experimental design data table. “Outpath” indicates the output path. The “droplist” assignment saves all columns, which are later dropped.
How is the JSL generated?
The JSL statements are created line-by-line in the SAS code using PUT statements. Before looking at this SAS code, lets consider the following tips on writing JSL for your JMP Life Sciences processes:
|
•
|
JSL code generation can be difficult at first because JSL has some unique aspects that must be understood in order for the code to run properly. One good way to learn JSL and determine the code you need is to let JMP generate the code for you. To do this, find and perform the analysis that you want from JMP using your mouse. Then click on the Script option in that window's pull-down menu (click on the little red triangle). This option allows you to save the generated JSL code in a JMP window or in a file. This method is an effective way to generate a wide variety of reusable JSL code templates.
|
|
•
|
Many of the processes in JMP Life Sciences have numerous examples of JSL code generation that you can cut, paste, and modify. These .jsl files are located in the ProcessLibrary folder of your installation folder. You should familiarize yourself with the different graphics generated by these processes and study their code.
|
|
•
|
|
•
|
When JMP reads in a SAS data set, it uses the SAS variable labels as its column names. So in your JSL code, you need to reference these labels, not the SAS variable names themselves. The %CheckLabel utility macro creates a macro variable that contains the label that you can reference when creating your JSL statements.
|
|
•
|
Arguably the most difficult part of creating a JSL script from SAS code is punctuating the code correctly. Be particularly mindful of single and double quotations marks, open and closed parentheses, commas, and semicolons. One good development practice is to work initially in a JMP Scripting Window and create JSL code that runs successfully there. (Click on the
|