The TMM Normalization process (Trimmed Mean of M component) is a scaling normalization method used for normalizing RNA-seq count data (Robinson and Oshlack, 2010).
The raw data set is first preprocessed and summarized into bins, exons, or genes in a tall data set where with each row contains the data from a unique individual bin, exon, or gene across all of the samples (columns). The M and A components between the experimental samples to be normalized and the reference sample are then calculated using a subset of data based on the specified trimming percentage to compute a weighted trimmed mean of the M component. This mean is then used as the scaling factor for the corresponding experimental data.
Note: A specified percentage of data in the lower and higher range of M and A components is factored out before computing the M component mean. Also, the inverse of the corresponding empirical variance of M component is set to be the corresponding weight when taking the trimmed mean.
Caution: This process can be computationally intensive for large data sets.
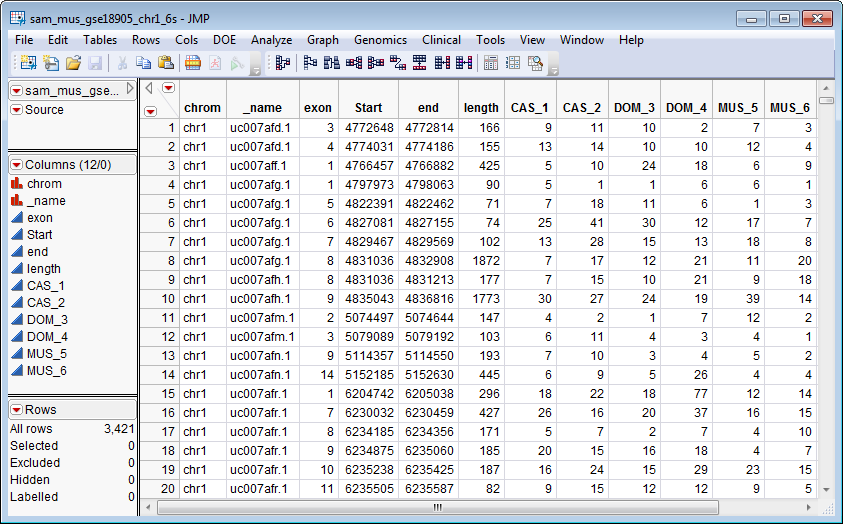
The first data set, the Input Data Set, contains all of the numeric data to be analyzed. This data set must be in the tall format where each sample corresponds to one row and each column corresponds to a separate experimental condition or array.
The trimmed sam_mus_gse18905_ch1_6s.sas7bdat data set shown below lists SAM data from genes located on chromosome 1 from 3 different mouse lines.
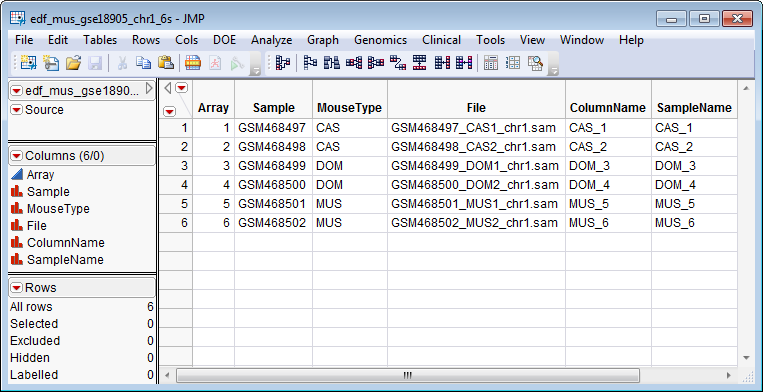
The second data set is the Experimental Design Data Set (EDDS). This required data set tells how the experiment was performed, providing information about the columns in the input data set. Note that one column in the EDDS must be named ColumnName and the values contained in this column must exactly match the column names in the input data set.
The edf_mus_gse18905_chr1-6s_sas7bdat EDDS, shown below, corresponds to the sam_mus_gse18905_ch1_6s.sas7bdat input data set.
The sam_mus_gse18905_ch1_6s.sas7bdat and edf_mus_gse18905_chr1_6s.sas7bdat data sets were downloaded from GEO.
For detailed information about the files and data sets used or created by JMP Life Sciences software, see Files and Data Sets.
Refer to the TMM Normalization output documentation for detailed descriptions of the output of this process.