Genotypic information for sets of alleles or markers is frequently listed using combinations of letters and numbers. Alternatively, data sets can use a two column allelic format in which each of the two alleles that make up a genotype is listed in a separate column. Such formats are not amenable to many forms of statistical analysis, which typically can use only single-column, numerical data. Before any analyses can be performed. Therefore, data sets containing genetic marker data in a non-numerical and/or allelic format must be recoded. Conversely, genotypes might have been originally coded numerically as the values 0, 1, and 2 or the genotype might be coded as a single letter -- "A" for genotype A/A, "B" for genotype B/B, and "H" for the heterozygous genotype A/B. Since the processes for analyzing genotype data require a representation that discerns the two alleles that the genotype comprises, converting the single character or numeric genotypes to this recognized form is necessary.
When numeric recoding of genotypes is performed, Recode Genotypes tabulates the SNP genotypes for all of the individuals in a data set, ranking the prevalence of each allele. Depending on the recoding desired, the process assigns numerical identities to the genotypes based on the prevalence of the alleles, whether they are homozygous or heterozygous, and their dominant/recessive relationship. Conversely, Recode Genotypes can also convert single character numeric (0, 1, and 2) or non-numeric (A, B, and H) back into a genotypic string (A/A, B/B, and A/B).
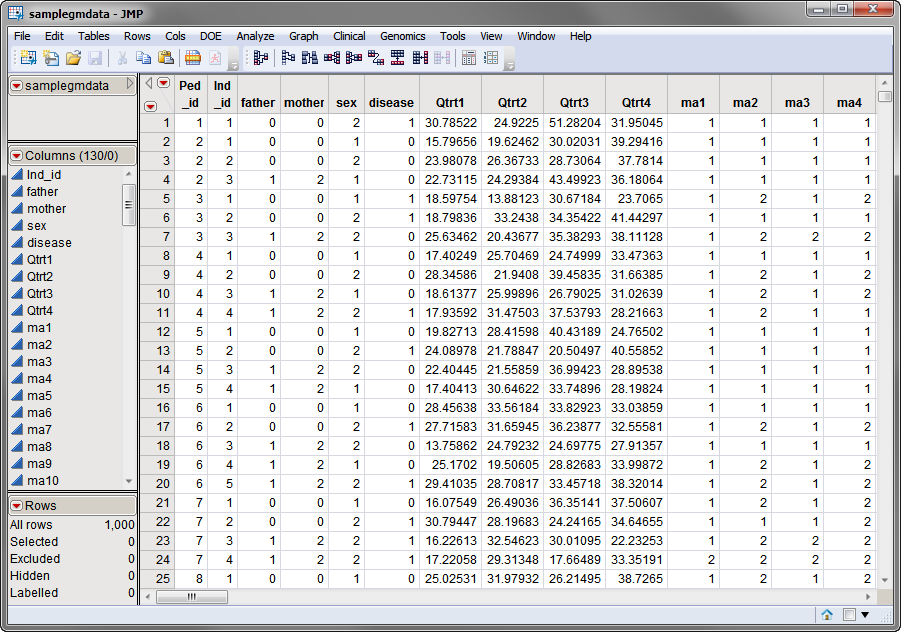
Two data sets are needed for this process. The first, the Input Data Set, contains all of the marker data. The sample data set used in the following example, the samplegmdata data set, was computer generated as described in Sample Genetic Marker Data. It consists of 1000 rows of individuals with 130 columns corresponding to data on these individuals. Marker data is presented in the two-column format. This data set is partially shown below. Note that this is a wide data set; markers are listed in columns, whereas individuals are listed in rows.
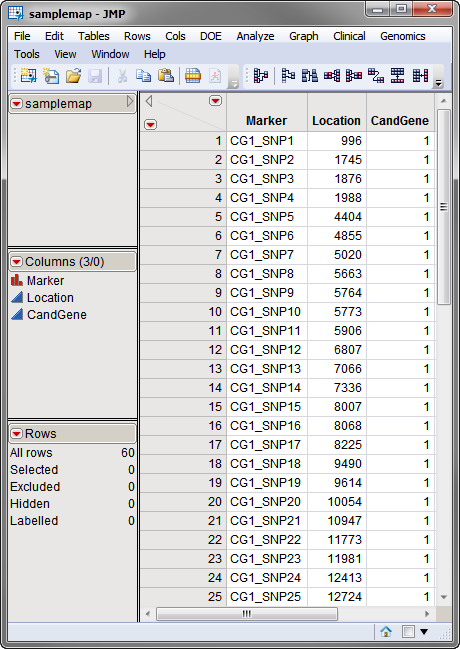
The second data set is the Annotation Data Set. This data set contains information, such as gene identity or chromosomal location, for each of the markers. The annotation data set used in this example, the samplemap data set, was computer generated and identifies markers, location and gene identities. A portion of this data set is illustrated below. This data set is a tall data set; each row corresponds to a different marker.
Note: The top-to-bottom order of the rows in the annotation data set matches the left-to-right order of the columns in the input data set. This correspondence is required for this process.
Both data sets are included in the Sample Data folder.
For detailed information about the files and data sets used or created by JMP Life Sciences software, see Files and Data Sets.
Output from this process is accessed from a Results window. Refer to the Recode Genotypes output documentation for detailed descriptions and guides to interpreting your results.