The Relationship Matrix process computes a symmetric matrix of pairwise relatedness measures for rows of the Input Data Set across all SNP loci.
Three genome-wide relatedness estimates can be calculated using the Relationship Matrix process:
|
1
|
Identical-By-Descent (IBD). This estimate refers to the probability that two individuals share an allele that came from the same ancestor at a locus. Given a large number of loci, many methods (reviewed in Oliehoek et al. 2006) have been proposed to estimate IBD across all markers without requiring a pedigree.
|
When Identity By Descent is chosen, a simple and logical genome-wide estimate of IBD across all markers is computed with the formula for locus l and individuals i, j given as:
where Xi,l = 0, 1, 2, corresponding to genotype BB, AB, AA at marker l respectively and p (q) is the allele frequency of allele A (B). This measure is averaged over all loci.
|
2
|
Identity By State. This estimate is equivalent to Gower's Similarity Metric as calculated using the Distance Procedure in SAS/STAT with a Range standardization.
|
|
3
|
Allele Sharing Similarity. This estimate is equivalent to Gower's Similarity Metric as calculated using the Distance Procedure in SAS/STAT without a Range Standardization.
|
Note: Yu et al. (2006) proposed a mixed model using a random effect for genome-wide relatedness that has a covariance structure proportional to an estimated IBD matrix.
Output data containing the NxN matrix can be used as input to either the Q-K Mixed Model, the K Matrix Compression, or the Multidimensional Scaling processes.
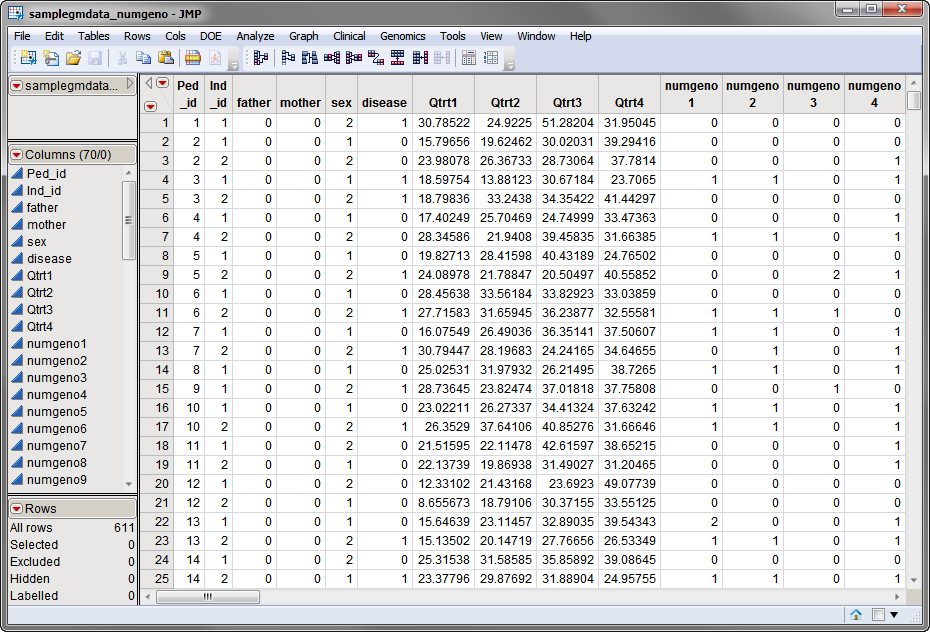
One Input Data Set containing all of the marker data, is needed for this process. The input data set should have the NxM wide format with N samples or individuals as rows and M markers in numeric format as columns. The sample data set used in the following example, the samplegmdata_numgeno.sas7bdat data set, was computer generated and consists of 1000 rows of individuals with 70 columns corresponding to data on these individuals. In this data set, genotypes for 60 markers (numgeno1 - numgeno60), are presented in the one-column format. This data set, described in Sample Genetic Marker Data, is partially shown below. Note that this is a wide data set; markers are listed in columns, whereas individuals are listed in rows.
For detailed information about the files and data sets used or created by JMP Life Sciences software, see Files and Data Sets.
The output generated by this process is summarized in a Tabbed report. Refer to the Relationship Matrix output documentation for detailed descriptions and guides to interpreting your results.