Large scale genetic mapping studies seek to associate genetic markers, such as SNPs, of known location, with various quantitative and qualitative phenotypic traits1. Because such fine-scale mapping requires the use of very large data sets, subsequent analysis using the Marker-Trait Association process often takes an inordinate amount of time. To mitigate this problem, particularly with regard to SNP data, a stripped-down version of Marker-Trait Association, hereafter referred to as SNP-Trait Association, was developed.
SNP-Trait Association was specifically designed for very large genetic data sets. As a result, you should consider running SNP-Trait Association for whole genome scans and other large processes.
SNP-Trait Association can output
|
•
|
|
•
|
survival curves for a survival trait.
|
Note: Unlike Marker-Trait Association, SNP-Trait Association does not fully accommodate multi-allelic markers, but accepts them. It creates a pseudo-bi-allelic marker using the most common allele as one allele and combining all other alleles into a single allele.
One Input Data Set is needed for this process. The samplegmdata.sas7bdat data set used in the following example was computer generated and consists of 1000 rows of individuals with 130 columns corresponding to data on these individuals. There are 2 categorical phenotypic variables (sex and disease status) and 4 quantitative phenotypic variables (Qtrt1, Qtrt2, Qtrt3, and Qtrt4). Genotypes for 60 different markers are presented in the two-column allelic format (ma1 — ma120). This data set is partially shown below.
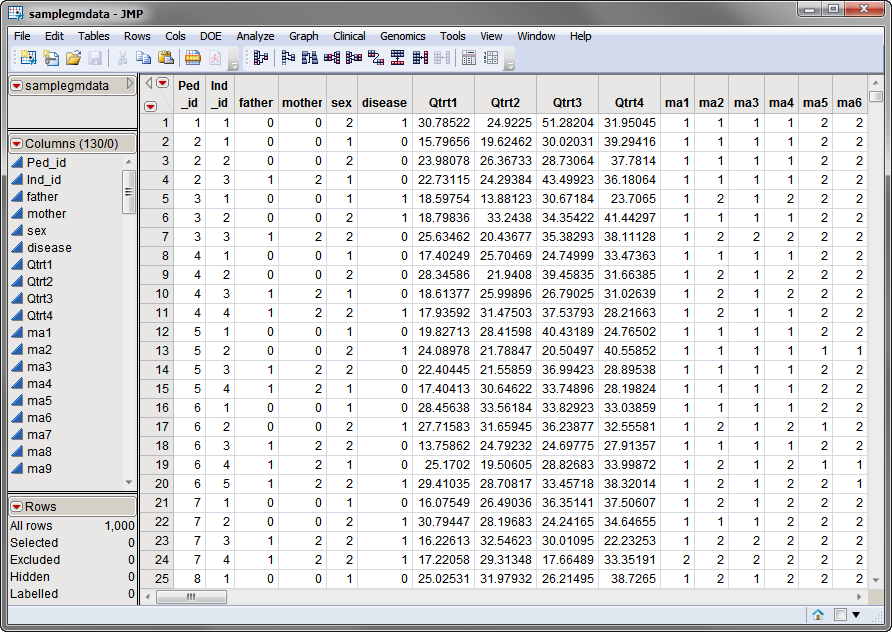
Note that this is a wide data set; phenotypes and markers are listed in columns, whereas individuals are listed in rows.
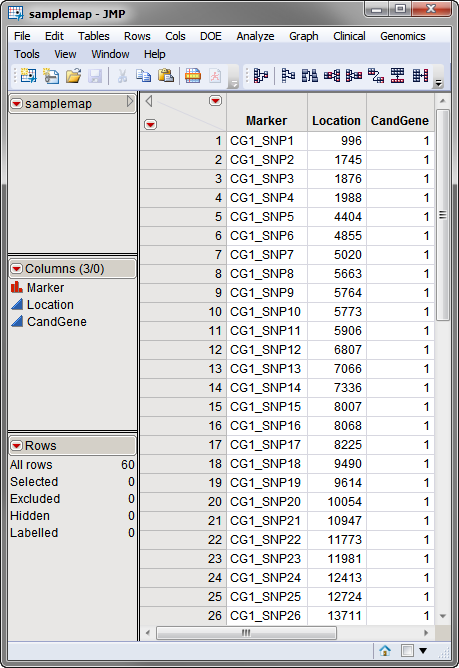
The second, optional, data set is the Annotation Data Set. This data set contains information, such as gene identity or chromosomal location, for each of the markers. The annotation data set used in this example, the samplemap data set, was computer generated and identifies markers, location and gene identities. A portion of this data set is illustrated below. This data set is a tall data set; each row corresponds to a different marker.
Note: The top-to-bottom order of the rows in the annotation data set matches the left-to-right order of the columns in the input data set. This correspondence is required for markers to be matched appropriately.
Both data sets are described in Data Sets Used in JMP Genomics Processes and are included in the Sample Data folder.
For detailed information about the files and data sets used or created by JMP Life Sciences software, see Files and Data Sets.
The output generated by this process is summarized in a Tabbed report. Refer to the SNP-Trait Association output documentation for detailed descriptions and guides to interpreting your results.
SNP-Trait Association uses different SAS PROCs , depending on the type of traits being analyzed. You should refer to Type of Trait for more information.