The Haseman-Elston Regression process tests for linkage between genetic markers and a quantitative or binary trait locus. Since the original Haseman-Elston approach was introduced (1972), modifications have been proposed to increase its power, as discussed by Wang and Elston (2004). These methods use sibling pairs and regress a function of the quantitative trait values for the individuals that the pair comprises on the average allele-sharing IBD (pi) and the probability of sharing 2 alleles IBD at the markers of interest (z2). When non-independent sib-pairs are included in the sample, a GEE approach is used to account for the covariance among pairs from the same family.
The Haseman-Elston Regression process is not applied to genetic marker data as are the other JMP Genetic processes. Instead, this process analyzes data containing information about the probabilities of pairs of individuals sharing alleles that are identical-by-descent (IBD) at the markers of interest. The required input IBD data set must contain one row for each pair of related individuals being analyzed at each marker, with variables z0, z1, and z2 representing the probability of the two individuals in the pair sharing 0, 1, or 2 alleles IBD, respectively. All possible pairwise comparisons within each family should be made. Variables for the pedigree or family, the two individual IDs, and the marker are also required in this data set. Pairs of individuals should be grouped by marker rather than by pedigree or family before carrying out these processes.
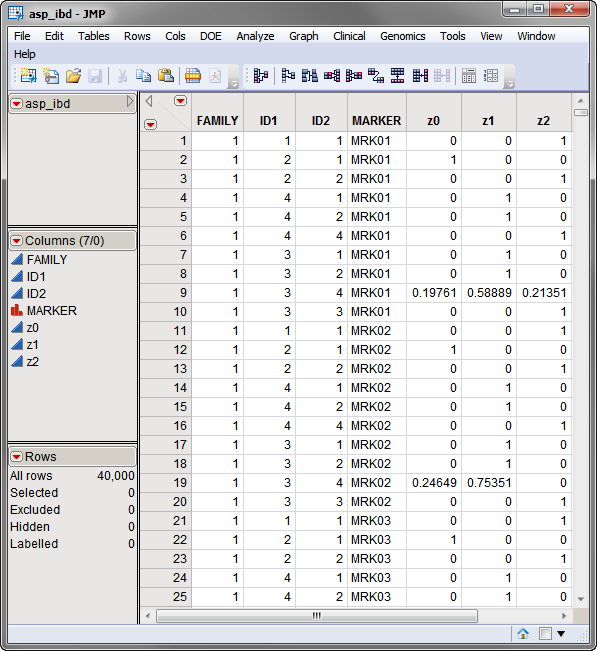
Two data sets are required to run this process. The first, the identical by descent (IBD) data set, contains the marker ID, pedigree ID, and the IBD probabilities. This data set must contain the following variables: a marker ID, a pedigree ID, and the IBD probabilities in columns z0, z1, and z2.The asp_ibd.sas7bdat IBD data set is shown below. Note that the required columns are present in this data set.
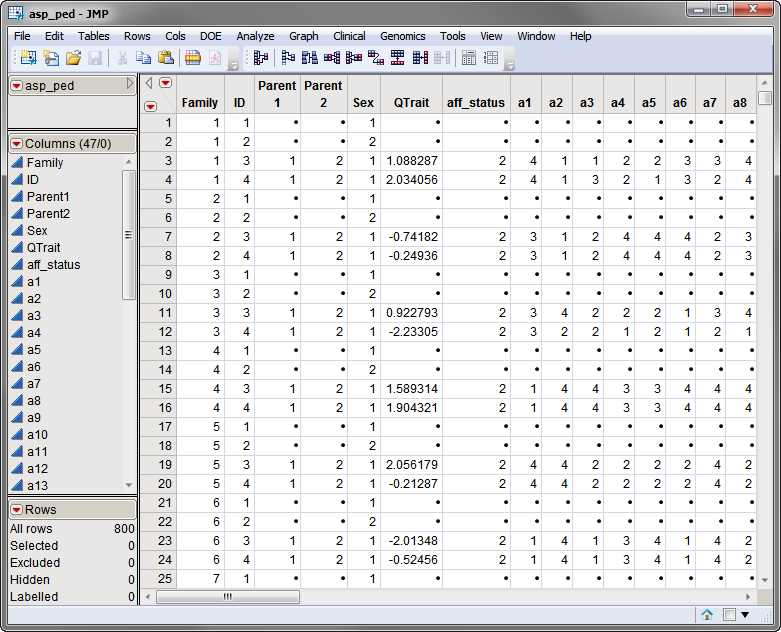
The second required data set, the pedigree data set, must contain the pedigree identifiers as well as the phenotype information including the quantitative trait being mapped and any covariates. The asp_ped.sas7bdat pedigree data set is shown below. Individuals in this data set must be listed before their offspring.
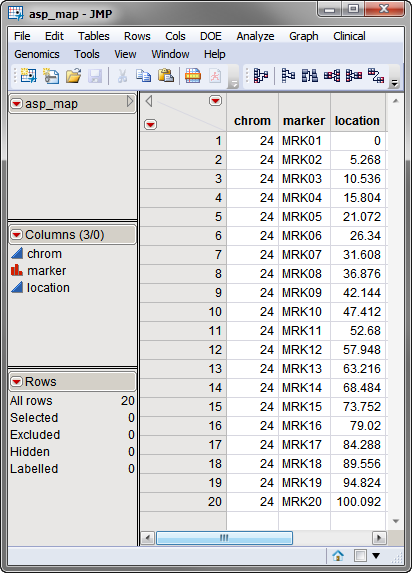
A third, optional, data set is the Annotation Data Set. This data set contains information, such as gene identity or chromosomal location, for each of the markers. The annotation data set used in this example, the asp_map.sas7bdat data set, was computer generated and identifies each of the 20 markers in the IBD data set and their locations. This data set is illustrated below. This data set is a tall data set; each row corresponds to a different marker.
The sample data used in the following example is the computer-generated affected sib-pair (ASP) data provided by Gonçalo Abecasis (University of Michigan Center for Statistical Genetics) and is described in Data Sets Used in JMP Genomics Processes. This data consists of three associated data sets:
|
2
|
a pedigree data set that lists the family relationships, affected status, and marker genotypes for each of the 800 individuals (4 per family) in the data set, and
|
Note: If you are curious about chromosome 24, recall that these are fictitious data.
All three data sets are included in the Sample Data folder that comes with JMP Genomics.
For detailed information about the files and data sets used or created by JMP Life Sciences software, see Files and Data Sets.
The output generated by this process is summarized in a Tabbed report. Refer to the Haseman-Elston Regression output documentation for detailed descriptions and guides to interpreting your results.