The Compare QTL Plots provides a quick and easy method for comparing results from multiple analyses. Output data sets from the QTL IM, CIM and MIM Analysis process are merged into one data set containing variables from the specified studies. The QTL Test Size and QTL Effect Size variables in the merged data set are overlaid on a single plot to facilitate the comparison of QTL mapping results from different methods and/or traits.
At least two Input SAS Data Sets are required. These include one Base Input SAS Data Set and at least one or as many as twelve Merge Input SAS Data Set (1-12). Both must contain containing Testing Location variables and QTL Test Size variables obtained from the QTL IM, CIM and MIM Analysis process.
The qtlsf_im.sas7bdat base input data set is shown below:
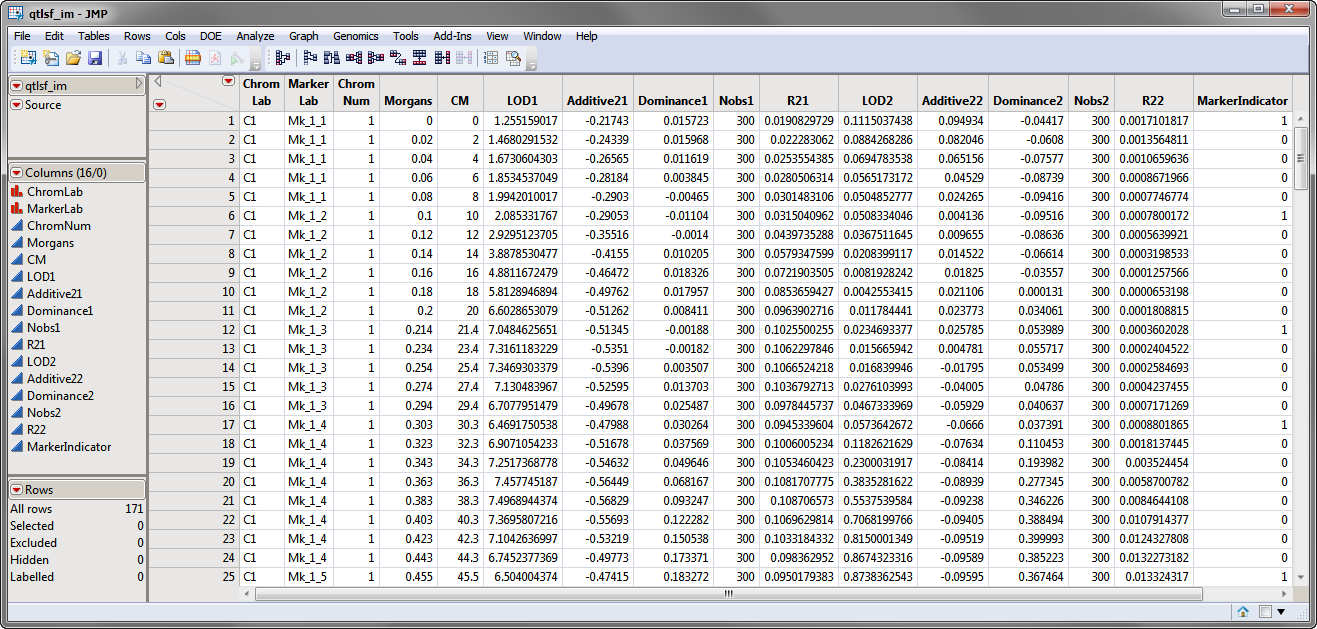
In this data set, CM serves as the Key Testing Location variable and LOD1 and LOD2 serve as the Test Size variables.
The qtlsf_cim.sas7bdat merge input data set is shown below:
The output generated by this process is summarized in a Tabbed report. Refer to the Compare QTL Plots output documentation for detailed descriptions and guides to interpreting your results.