The Haplotype Q-K Mixed Model process uses information about the individuals' probabilities for haplotype pairs (the Phase Assignment data set from the Haplotype Estimation process) to test for association of each haplotype with traits, while simultaneously controlling for family relatedness (K matrix) and population structure (Q matrix). This process uses PROC MIXED for continuous traits, PROC GLIMMIX for count traits as well as binary traits with random effects in the model, and PROC LOGISTIC for models without random effects. Two models are adjusted for each window ID: single and global. In the single model, a model is fitted separately for each haplotype for each window ID, while in the global model, a model is fitted including all haplotypes for each window.
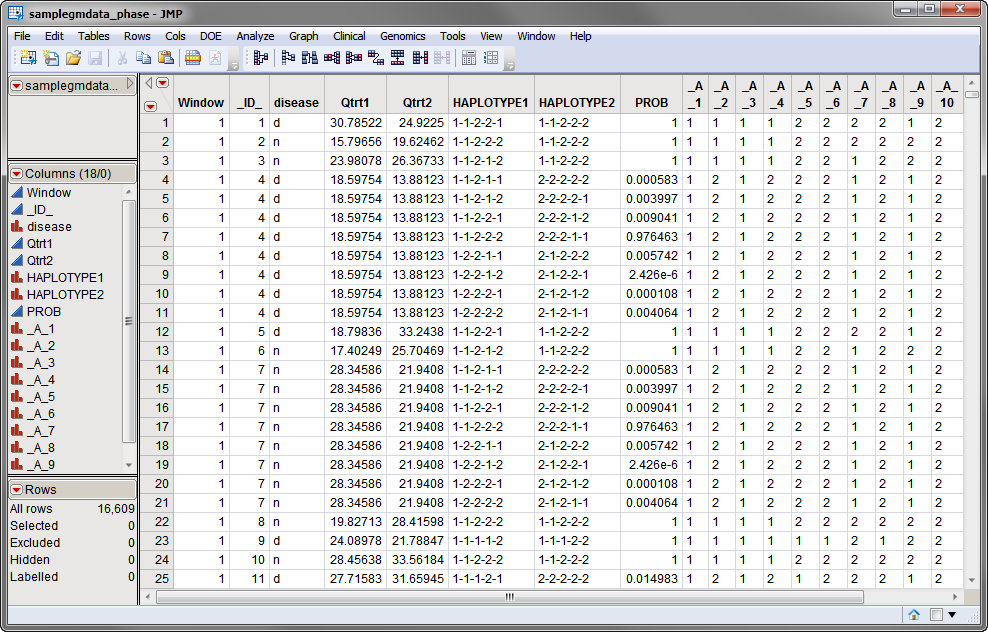
The first is the phase assignment data set. The samplegmdata_phase.sas7bdat data set, shown below, was generated using the Haplotype Estimation process from data contained in the samplegmdata.sas7bdat data set. The samplegmdata.sas7bdat data set, described in Data Sets Used in JMP Genomics Processes, was computer generated and consists of 1000 rows of individuals with 130 columns corresponding to data on these individuals. The Individual ID, disease, Qtrt1, and Qtrt2 columns were selected as ID variables from the original data set and were included in the samplegmdata_phase.sas7bdat data set. Haplotypes, defined by sliding windows encompassing 5 adjacent markers, are listed in a pair of columns. The probability of observing the co-occurrence of a specific pair of haplotypes in an individual is listed. Different haplotype pairs contain the alleles listed in columns _A_1 through _A_10 at the five markers in the sliding window.
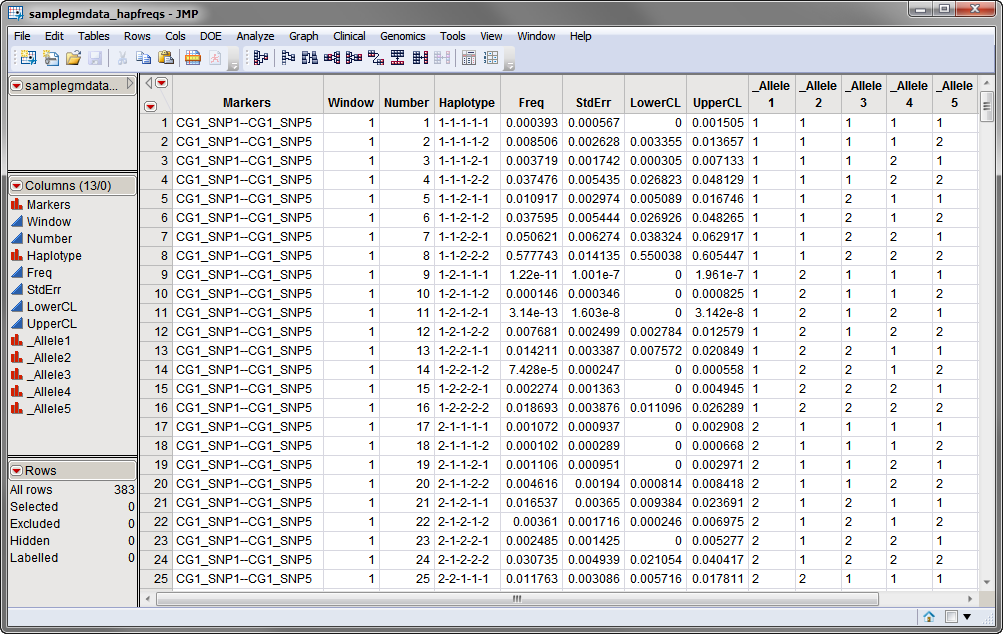
A second, required, data set, the haplotype frequency data set, lists the estimated frequencies for each of the haplotypes for the original data set. These frequencies are used for identifying and combining rare haplotypes if a value greater than 0 is entered for the Frequency Cutoff for Combining Haplotypes parameter. The samplegmdata_hapfreqs.sas7bdat data set, shown below, was generated from the samplegmdata.sas7bdat data set using the Haplotype Estimation process.
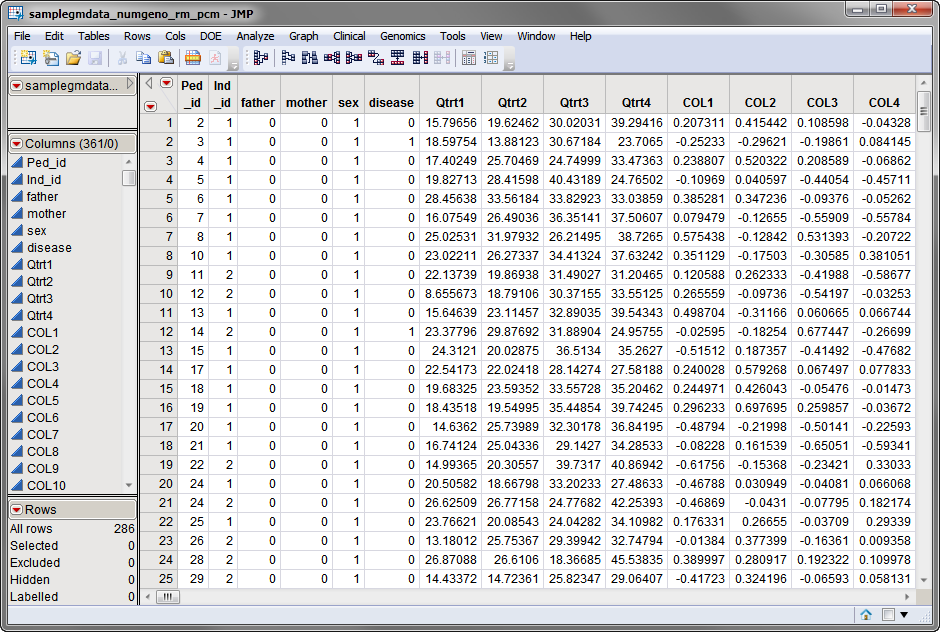
A third, required, data set is the Q and K data set. The data set used in the following example, the samplegmdata_numgeno_rm_pcm.sas7bdat data set, which was generated from the samplegmdata.sas7bdat described in Sample Genetic Marker Data, contains a root identity-by-descent (IBD) matrix computed for 60 computer-generated SNP genotypes by single value decomposition (SVD) from the Relationship Matrix process, a compressed IBD matrix from theK Matrix Compression process, a principal components matrix from the PCA for Population Stratification process, a coordinates matrix from the Multidimensional Scaling process, and a population membership probability, all merged with the original data. This data set is partially shown below. Note that this is a wide data set; markers are listed in columns, whereas individuals are listed in rows.
The samplegmdata_phase.sas7bdat, samplegmdata_hapfreqs.sas7bdat , and samplegmdata_numgeno_rm_pcm.sas7bdat data sets are contained in the Sample Data folder included with JMP Genomics.
Output from this process is accessed from a Results window. Refer to the Haplotype Q-K Mixed Model output documentation for detailed descriptions and guides to interpreting your results.