Numerous factors can affect the absolute values of the raw data generated in any microarray experiment. Before such data can be analyzed and assessed, it is usually necessary to normalize experimental results against some standard. JMP Life Sciences provides a variety of different processes for normalizing your data. Because no one method for selecting methods for normalization and standards is best for all experiments and situations, you are advised to try several methods and evaluate the results before proceeding further with your analysis.
In this example, we examine the distribution patterns of the Drosophila Aging Experimental Data of Jin, et al. (2001) before and after normalization to evaluate the efficacy of different normalization methods.
The raw data from this experiment were evaluated using distribution analysis. The overlay plot (shown below) shows the raw univariate distributions of all 48 channels from the 24 arrays.

Tthe Drosophila Aging Experimental Data of Jin, et al. (2001) were normalized using ANOVA Normalization, Mixed Model Normalization, Control Set Normalization, Quantile NormalizationLoess Normalization, Factor Analysis Normalization, and Partial Least Squares Normalization, . Normalized data were then visualized by Distribution Analysis and evaluated.
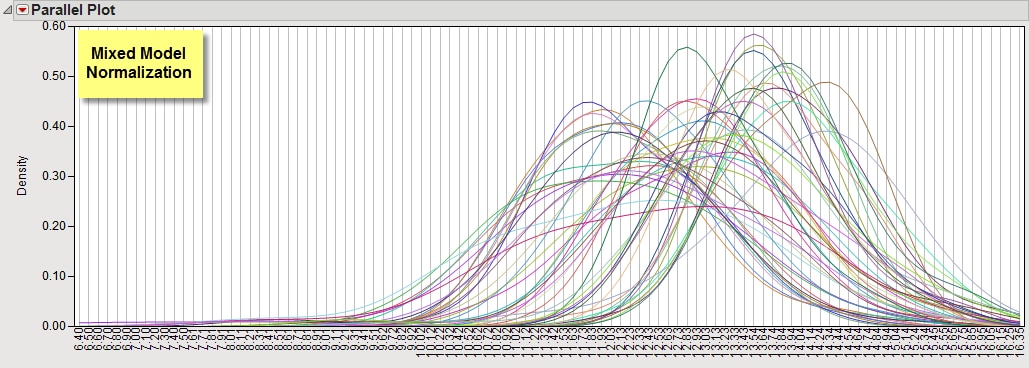
Visually, the variation among the estimated distributions originally seen for the raw data has been somewhat reduced in both the ANOVA normalized and the Mixed Model normalized data. However, there has not been a great reduction in variability, so other methods for normalizing the input data should be considered.

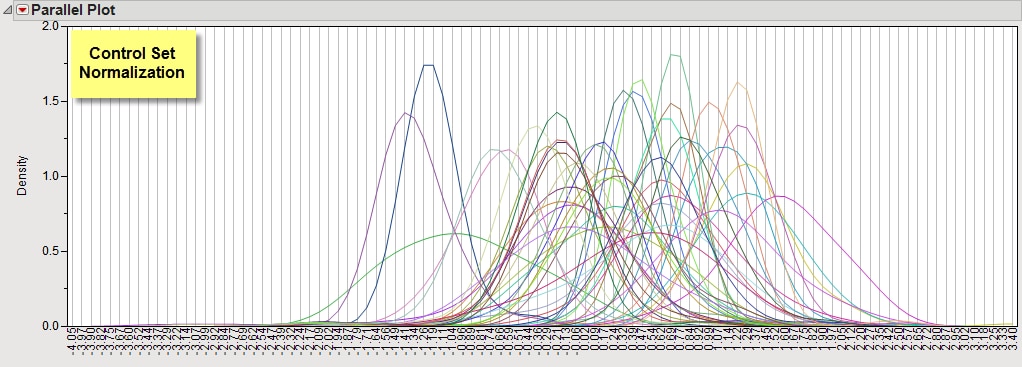
Control Set normalization (below) appears to have actually increased variability between experiments and would not be appropriate for this data.
Analysis of the Quantile normalized data (below) showed that the variation among the estimated distributions originally seen for the raw data has been completely eliminated. Unfortunately the extreme uniformity distribution suggests that the intensity data have probably been over-corrected. Such over correction might cause you to miss significant differences and you should proceed with caution whenever you see such a uniform distribution.

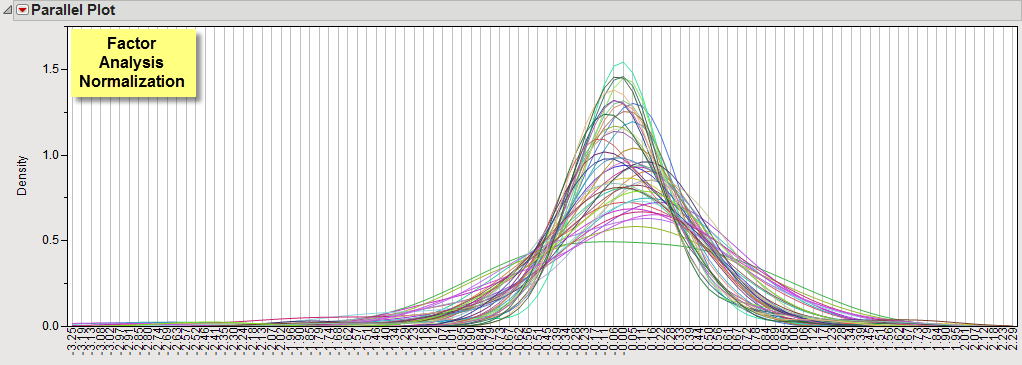
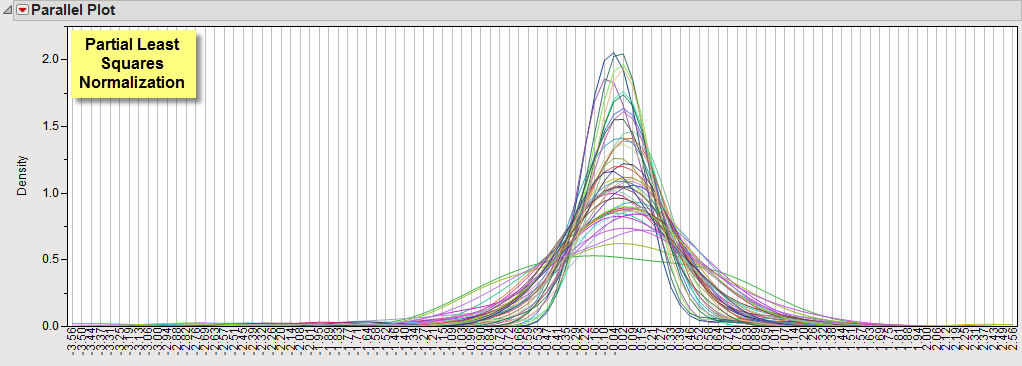
Distribution analyses (below) showed that the Loess, Factor Analysis, and Partial Least Square normalization processes were more effective than other methods at reducing the variation among the estimated distributions originally seen for the raw data, yet were not so aggressive as to preclude a reasonable chance for observing significant differences. One or more of these methods should be used in the analysis of this data.