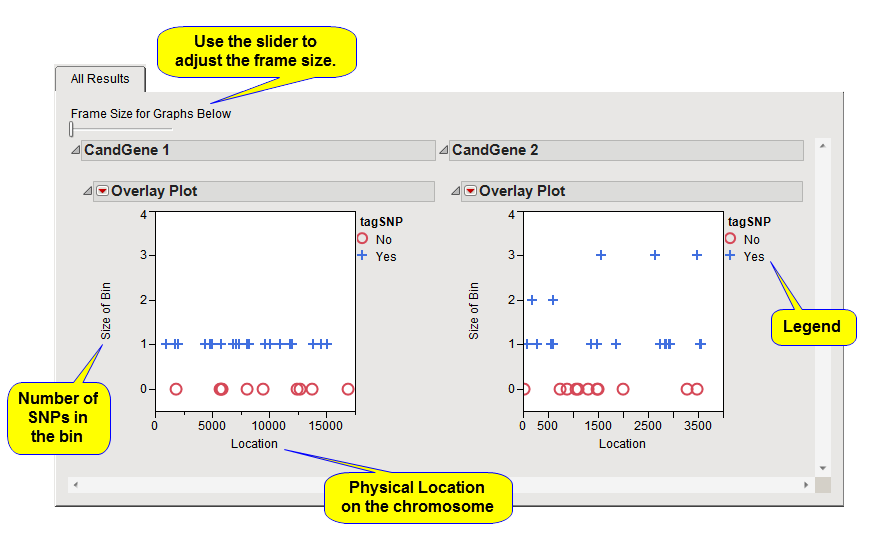
This tab displays a plot with SNP locations along the x-axis and the size (the number of SNPs) for the bin to which the SNP belongs along the y-axis. A separate plot is generated for each annotation group.
This tab displays a plot with SNP locations along the x-axis and the size (the number of SNPs) for the bin to which the SNP belongs along the y-axis. A separate plot is generated for each annotation group.