A separate Annotation Group Results tab is generated for each annotation group defined by the values of the Annotation Group Variable. Each tab is named for a specific group. There are two annotation groups (CandGene1 and CandGene2) specified in the samplegmdata setting used in this example. The CandGene1 Results tab is shown below:
The Annotation Group Results tab contains the following elements:
|
•
|
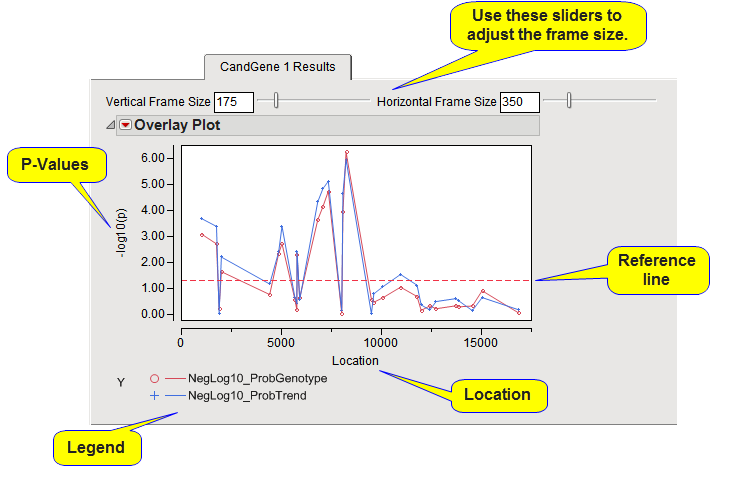
One or more P-Value Plots.
|
In this Overlay Plot, the Y-axis variable is the p-value from the association tests, converted to the -log or -log10 scale if selected in the process dialog. The X-axis plots the location of the markers according to the annotation location variable within the annotation group. A horizontal reference line is drawn as a red, dashed line at the significance level that was specified. For -log- or -log10-converted p-values, markers above this line are significant; for p-values on the original scale, markers below the line are significant. All tests are included in a single plot with a legend displaying the line and point color and marker for each test. If any BY variables were selected, a separate chart is displayed for each BY group.
|
•
|
One or more Odds Ratio Volcano Plots.
|
When the trait is binary and the Calculate trend odds ratios check box has been checked, each Annotation Group Results tab also contains an odds ratio volcano plot.

The y-axis variable of this scatter plot is the p-value from the association test, converted to the -log or -log10 scale if selected in the process dialog. The x-axis plots the log of the odds ratio for each marker. If the log odds are 0, then the odds ratio is 1 implying the odds of being affected with the disease (or whatever the trait variable represents) is the same for any number of minor allele at that particular SNP. Values on the x-axis greater than 0 represent odds ratios greater than 1, and thus the odds of being affected increases with the number of minor alleles composing the genotype. The opposite is true for log odds less than 0. A horizontal reference line is drawn as a red, dashed line at the significance level that was specified. For -log- or -log10-converted p-values, markers above this line are significant; for p-values on the original scale, markers below the line are significant.
Note: For the SNP-Trait Association process, odds ratio volcano plots are generated only for binary traits and only when the Calculate trend odds ratios check box is checked.
Note: For the Haplotype Estimation process, there is a point for each marker window instead of for each marker.