The Cell Plot tab is shown below:
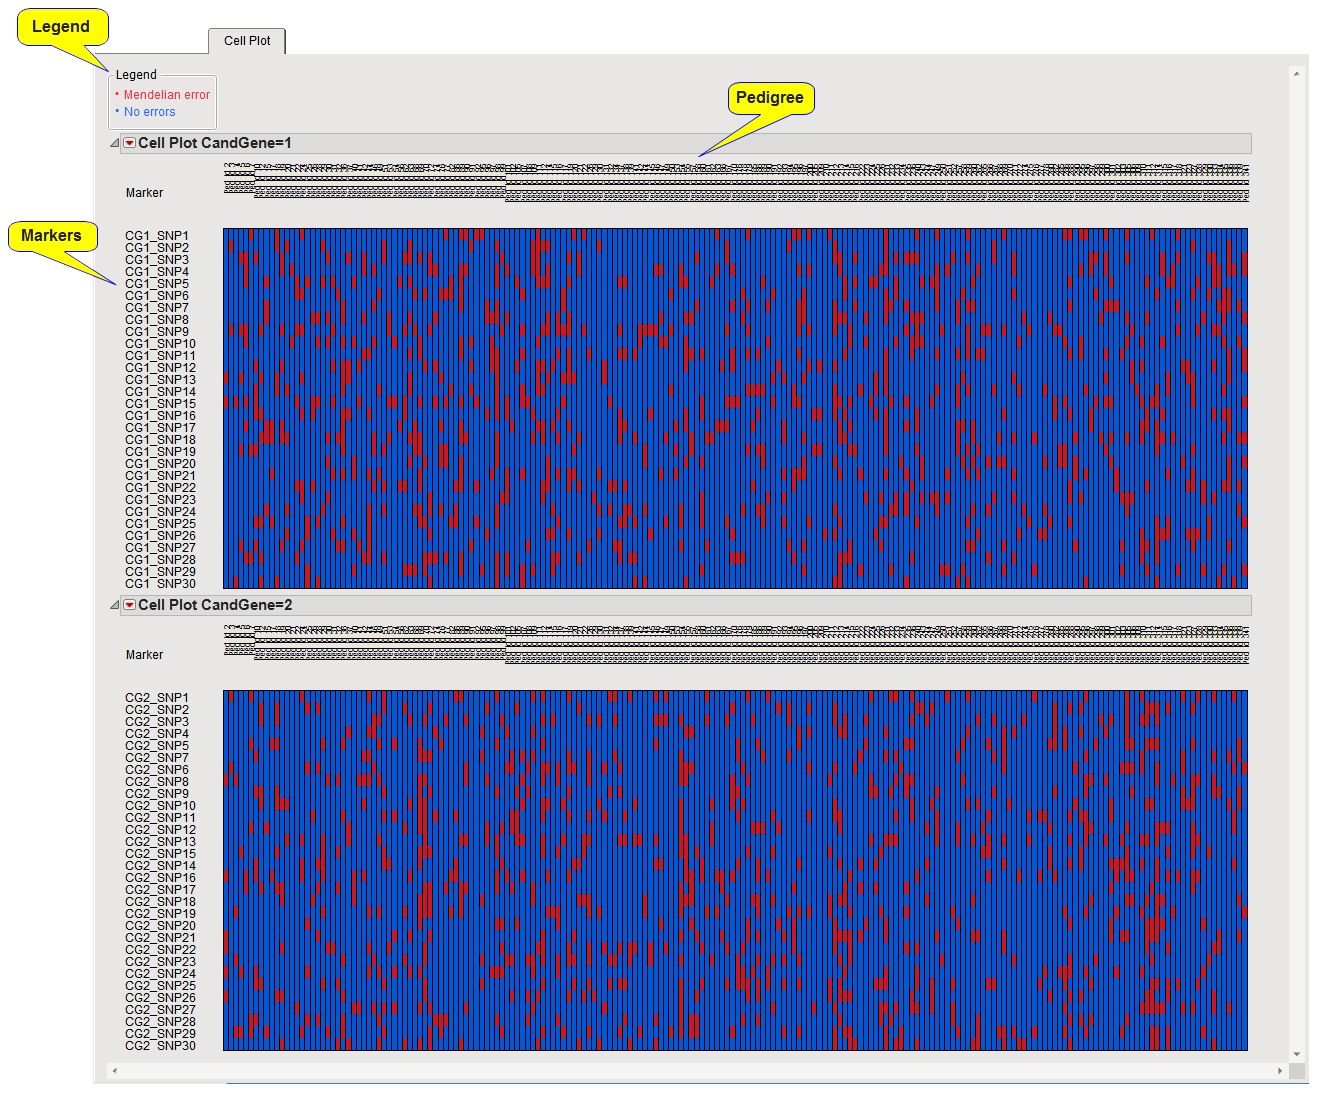
The Cell Plot tab contains the following:
For each annotation group, a cell plot is displayed with the cell for the marker and pedigree colored according to whether a Mendelian error was present in the family at that marker or not.