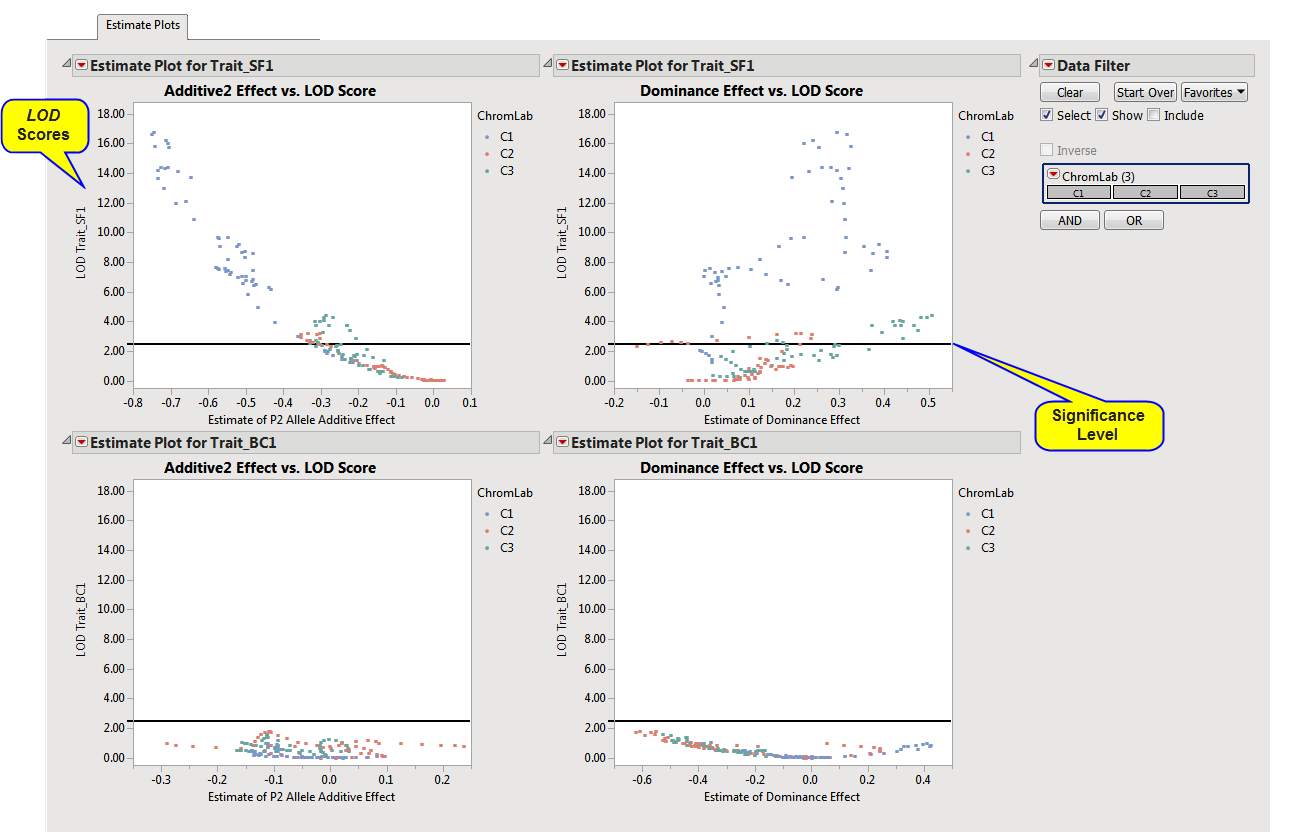
The Estimate Plots tab is shown below:
The Volcano Plots tab contains the following elements:
|
•
|
A Volcano Plot for each quantitative trait.
|
The volcano plot(s) show the LOD score for each trait plotted on the y-axis versus either the Estimate of the Additive Effect on the x-axis or the Estimate of the Dominance Effect (coded in reference to the effect of the parental line 2 or P2 allele). Each point on the plot represents a QTL testing location, with points colored by the chromosome or linkage group. Negative estimates indicate that there was a decrease in the quantitative trait associated with the allele from parental line 2. The black horizontal line represents a LOD threshold that was either specified on the process dialog or determined using permutation testing. Points to the upper left or upper right indicate locations with increasing evidence of a significant QTL that have large negative or positive effect on the trait of interest.
The JMP Data Filter has also been embedded into this tabbed view to use for interactively selecting points in the plots.