The Genomics Variance tab is shown below:
The Genomic Variance tab contains the following elements:
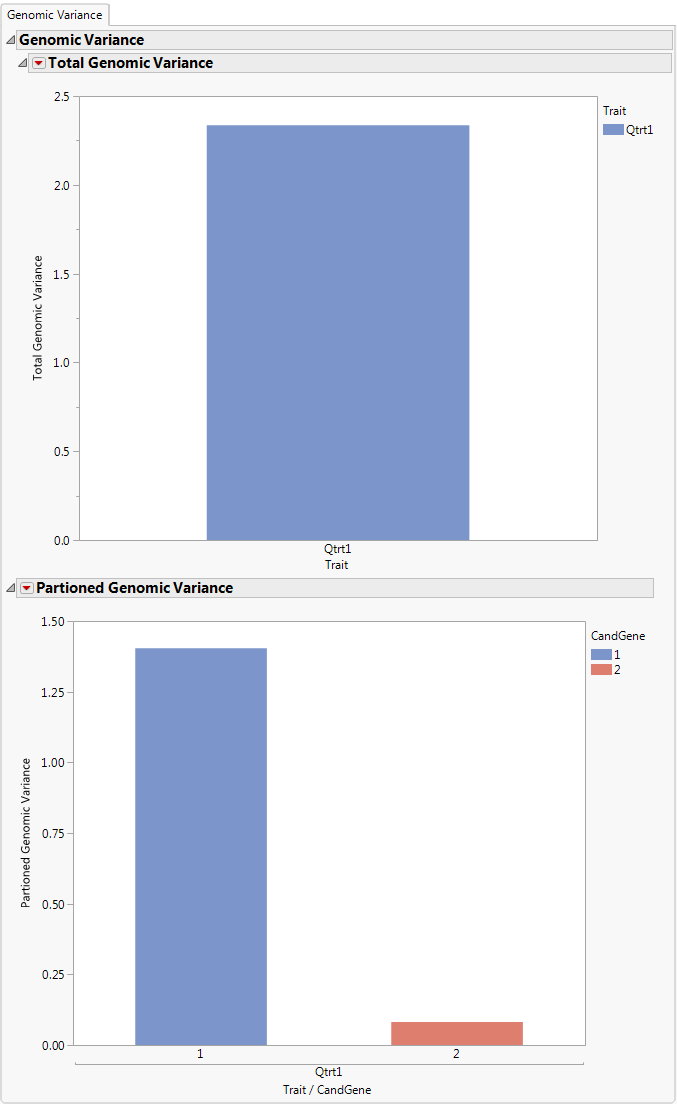
This is a graph of the genetic variance explained by all markers (y-axis) for each trait variable (x-axis).
This is a graph of the genetic variance explained by markers (y-axis) on each annotation group for each trait variable (x-axis). The genetic variances for each annotation group are estimated by fitting a mixed model with all additive relationship matrices computed for each annotation group.