This tab can appear quite different depending on the linkage grouping method specified using the Choose a linkage grouping method parameter. The results for each method are discussed below:
The Linkage Group Results tab generated when either Automated Hierarchical Clustering or Minimum Recombination Grouping is selected as the linkage grouping method is shown below:
The LD Decay tab generated whenever Automated Hierarchical Clustering or Minimum Recombination Grouping is selected as the linkage grouping method contains the following elements:
|
•
|
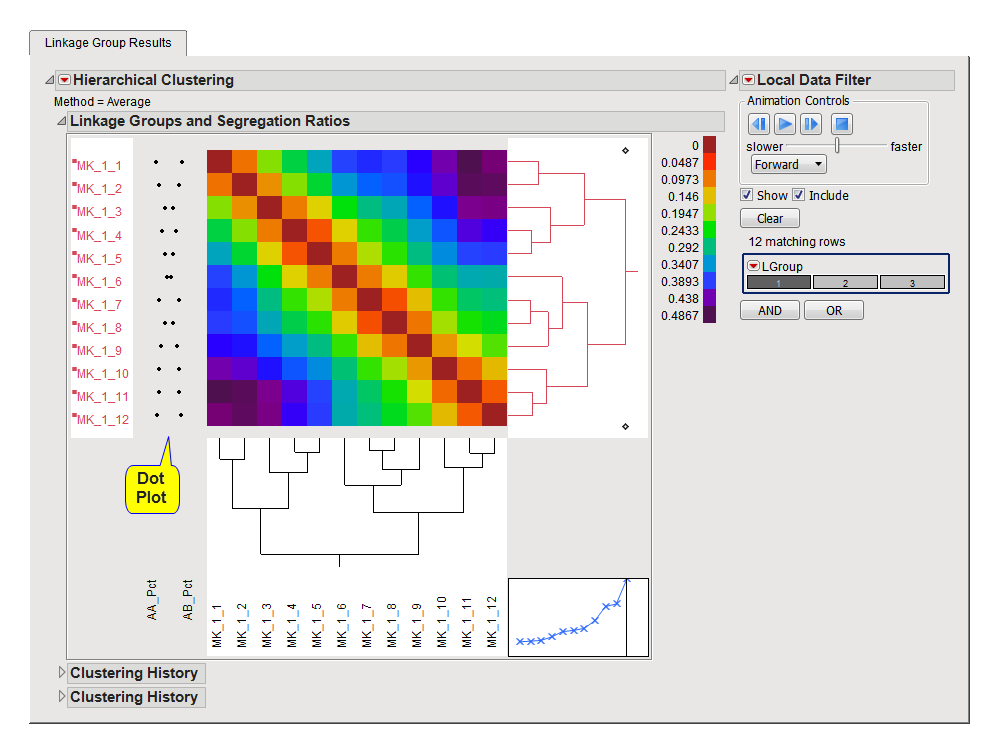
A set of hierarchical clustering Heat Map and Dendrograms, shown one at a time using the JMP Data Filter.
|
The heat map in the hierarchical clustering platform is used to visualize patterns in the recombination matrix for markers grouped into a linkage group. The heat map colors correspond to the recombination frequency value between pairs of markers within the same linkage group. You can iterate through and view each linkage group and their patterns using the data filter on the right hand side. On the left side of the heat map, a dot plot is used to show patterns in genotype frequencies. This dot plot can highlight outliers or markers exhibiting segregation distortion.
This panel can be used to alternate the heat map view between the linkage groups formed. By clicking, scrolling or through animation, you can change the current linkage group shown using the LGroup variable, which contains the linkage group membership computed. Click the button to reset the view to show a heat map of the full recombination matrix (not broken down by linkage groups). The color of the right dendrogram and the marker labels corresponds to the linkage group assigned. The clustering platform might not show markers as grouped by their linkage groups if a Framework Map or if Minimum Recombination Grouping was used.
Warning: If there are linkage groups containing only one marker, the hierarchical platform cannot be computed. If you click on a linkage group with just one marker, the view will disappear and you will need to click to a different linkage group and recalculate the platform view.
The Linkage Group Results tab generated when Interactive Hierarchical Clustering is selected as the linkage grouping method is shown below:
The LD Decay tab generated whenever Interactive Hierarchical Clustering is selected as the linkage grouping method contains the following elements:
|
•
|
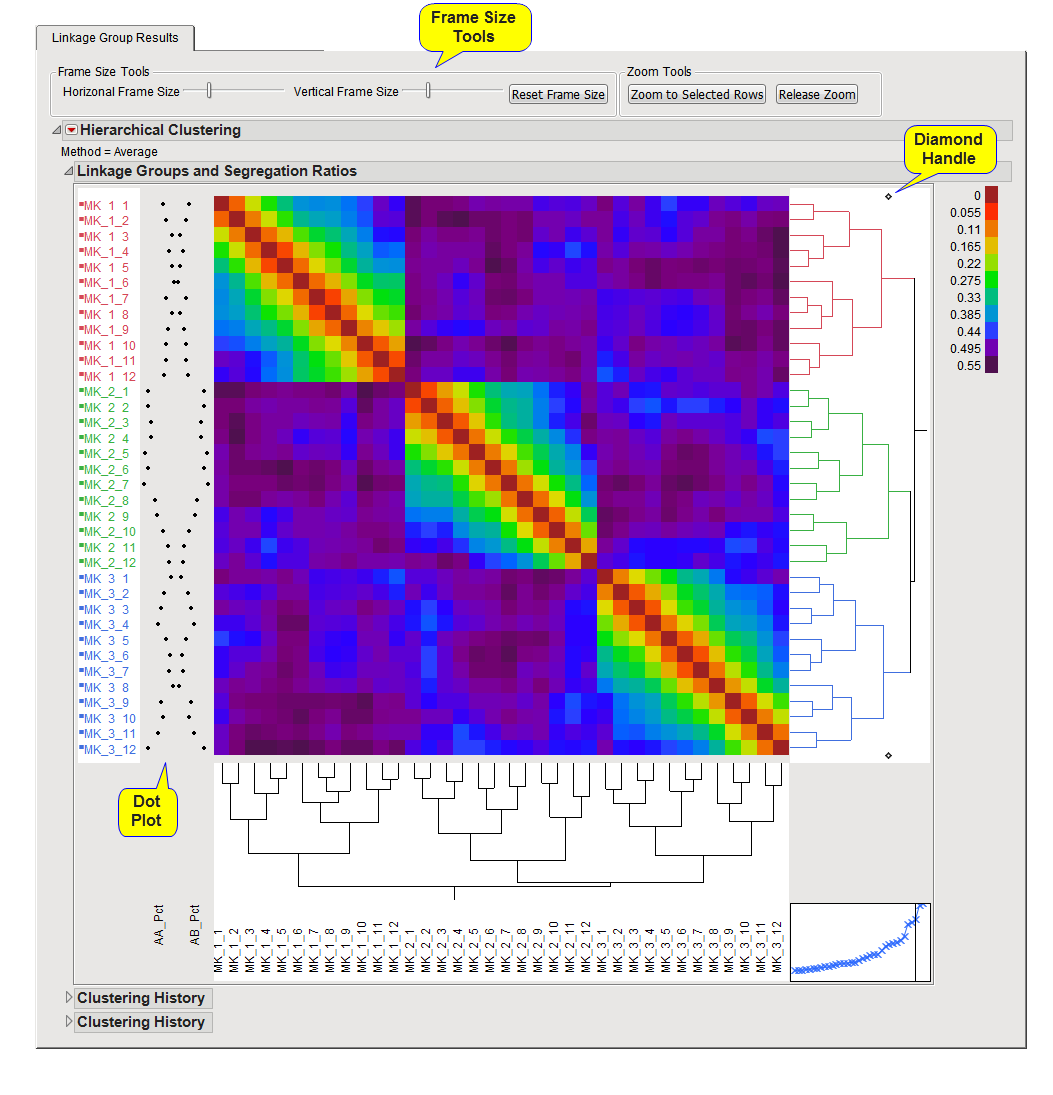
When you choose to assign linkage groups interactively, the JMP hierarchical clustering platform is use to display the heat map of the entire matrix of recombination frequencies between pairs of markers. The heat map is colored based on values of pairwise recombination frequencies across makers. The markers will be clustered based on patterns in this matrix into linkage groups. The initial number of linkage groups (as specified using the Initial Number of Linkage Groups parameter) is used to color and assign linkage group membership in the variable named LGroup. The dot plot on the left side of the heat map displays genotype frequencies for each marker and can be useful to determine markers that are in segregation distortion or help with determining breakpoints for linkage groups.
The diamond handle at the top and bottom of the dendrogram on the right side of the heat map can be slid to the left (to create more linkage groups with fewer markers in each) or to the right (to create a smaller number of linkage groups that contain more markers) to change linkage group membership. Once you have chosen the level of linkage groups that you deem appropriate with the pattern in the markers, you can click the Save Current Linkage Group Membership action button to save the information to the data set.
The results on this tab, shown in the heat map(s) are interactive and linked to the results on the Linkage Groups and Segregation tab. You can selection rows by clicking on portions of the dendrogram on the right (which can quickly select groups of markers) or by clicking on the heat map, marker labels, or dot plot to select individual markers. You can then view where these markers lie in terms of testing segregation distortion or choose to exclude selected markers with the Exclude Markers and Rerun Analysis action button.