When there are multiple annotation groups, a Manhattan plot is used to show p-values for all markers from a particular type of test in a single scatter plot. A separate plot is created for each association test performed, and if any BY variables were selected, a separate chart is displayed for each BY group as well.
A Manhattan Plot tab is shown below with markers grouped by chromosome (not necessarily created by this example):
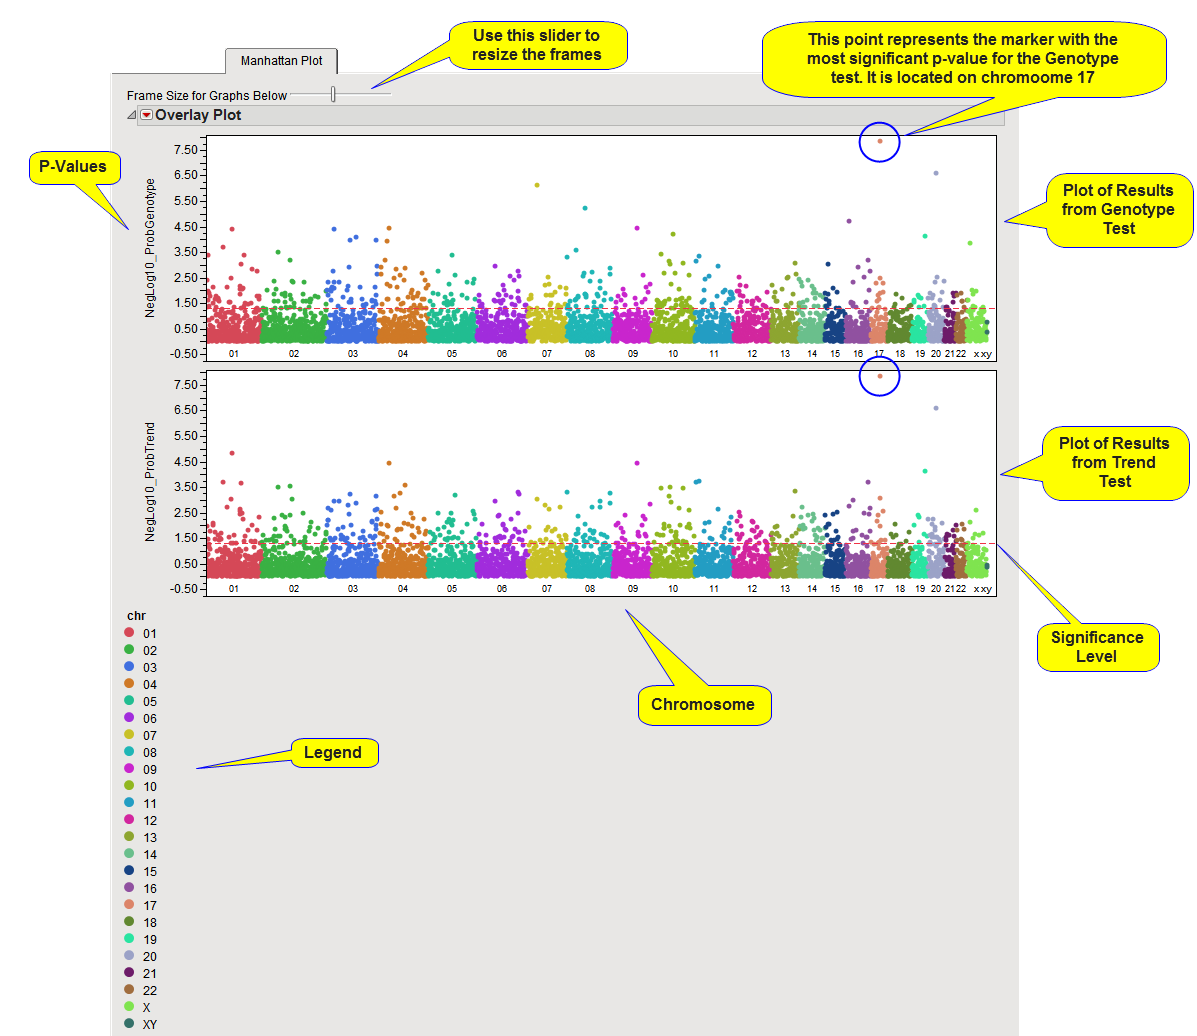
A separate plot is created for each association test performed, and if any BY variables were selected, a separate chart is displayed for each BY group as well. In the example shown above. In the example shown here, both the Genotype and Trend association tests were run. No By variables were selected.
The y-axis variable is the p-value from the association test, converted to the -log or -log10 scale if selected in the process dialog. The x-axis plots the markers in cumulative order within and across annotation groups. Each annotation group is assigned a color that is displayed in a legend below the plots.
A horizontal reference line is drawn as a red, dashed line at the significance level that was specified. For -log- or -log10-converted p-values, markers above this line are significant; for p-values on the original scale, markers below the line are significant. In this example, both tests showed the same marker (circled in the plots above) to be most significantly associated with the trait of interest.
On this plot or any of the other p-value plots, simply mouse-over any of the points on the plot to see the marker's label, for example, reference SNP ID. When an annotation accession variable is specified when running the process, you can select a point and click on any of the Annotation action buttons (GenBank Nucleotide, UniGene Database, AceView Database, or dbSNP) to link directly to the corresponding website to view extensive annotation information about the locus.
Also, from this tab or any of the other p-value plot tabs described below, subsets of or individual markers of interest can be examined in more detail by clicking on the action buttons. Subset data sets can be created by clicking on the Create Subset Genotype and Annotation Data Sets to be used in subsequent processes for further investigation. Distributions of genotypes in the different trait groups can be viewed when genotypes are in the numeric genotype format by clicking on the Plot Trait by Genotype button.
Note: For the Haplotype Estimation process, there is a point for each marker window instead of for each marker.
Note: For the Marker Properties process, one HWE test is run instead of one or more association tests. There is no Plot Trait by Genotype button. In addition to the Create Subset Genotype and Annotation Data Sets option, subsets can be generated for use in subsequent processes by using the Filter Markers/Individuals Based on the Criteria Below option.