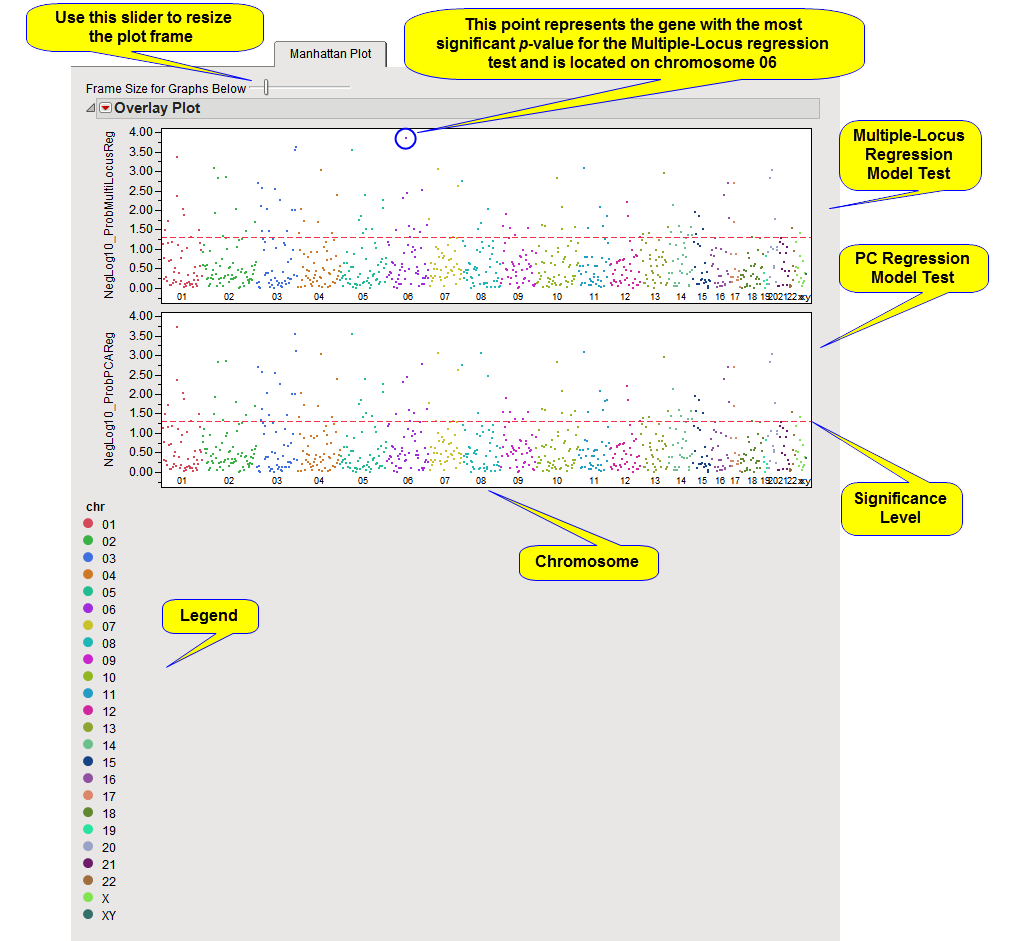
When there are multiple annotation plotting groups such as chromosomes, a Manhattan plot is used to show p-values for all genes (or other type of annotation analysis groups) from a particular type of test in a single scatter plot.
The Y-axis variable is the p-value from the association test, converted to the -log or -log10 scale if selected in the process dialog. The X-axis plots the genes in cumulative order, according to the location of the first SNP in the gene, within and across annotation plotting groups.
A horizontal reference line is drawn as a red, dashed line at the significance level that was specified. For -log or -log10-converted p-values, genes above this line are significant; for p-values on the original scale, genes below the line are significant.
A separate plot is created for each association test performed (plots for two different tests are shown above), and if any BY variables were selected, a separate chart is displayed for each BY group as well.
On this plot or any of the other p-value plots, you can mouse-over any of the points on the plot to see the gene's label. When an annotation accession variable is specified when running the process, you can select a point and click on any of the Annotation action buttons - GenBank Nucleotide, UniGene Database, AceView Database, or dbSNP - to link directly to the corresponding website to view extensive annotation information about the gene's first locus.