The Results tab generated by this process depends on the compression method specified.
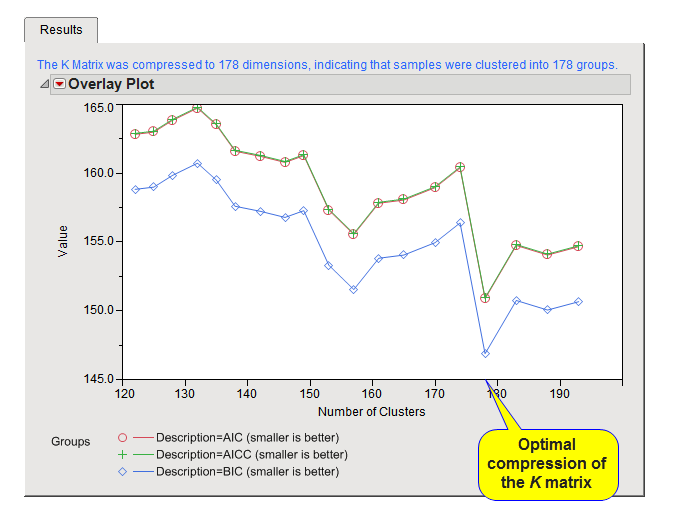
This plot shows the output of the Optimized K matrix compression algorithm. The mixed model for trait association is fit without the SNP marker in the model at varying levels of K matrix compression (performed by hierarchical clustering of the K matrix between all samples). The resolution of the intervals of K matrix compression/clustering can be controlled by options on the process dialog. At each level, the model is evaluated for performance with metrics such as AIC, AICC, and BIC (smaller values indicate a better fitting model). The plot on the Results tab displays these model performance criteria on the y-axis versus the levels of compression of the K matrix on the x-axis. The optimized compression method (as described by Zhang et al. Nature Genetics. 2010) chooses the level of compression at the minimum value of the chosen metric for the Criterion for Optimal Compression Level parameter.
Text above the plot details the final dimension of the K matrix that was chosen as optimal based on the mixed model for association testing. In the example settings, the K matrix was found to be optimal for the association mixed model at 178, indicating that the 193 individuals in the study could be clustered into 178 groups to reduce size of the random genetic effect in the model. This corresponds well to the data as there were known to be a handful of related samples that had a close family structure.
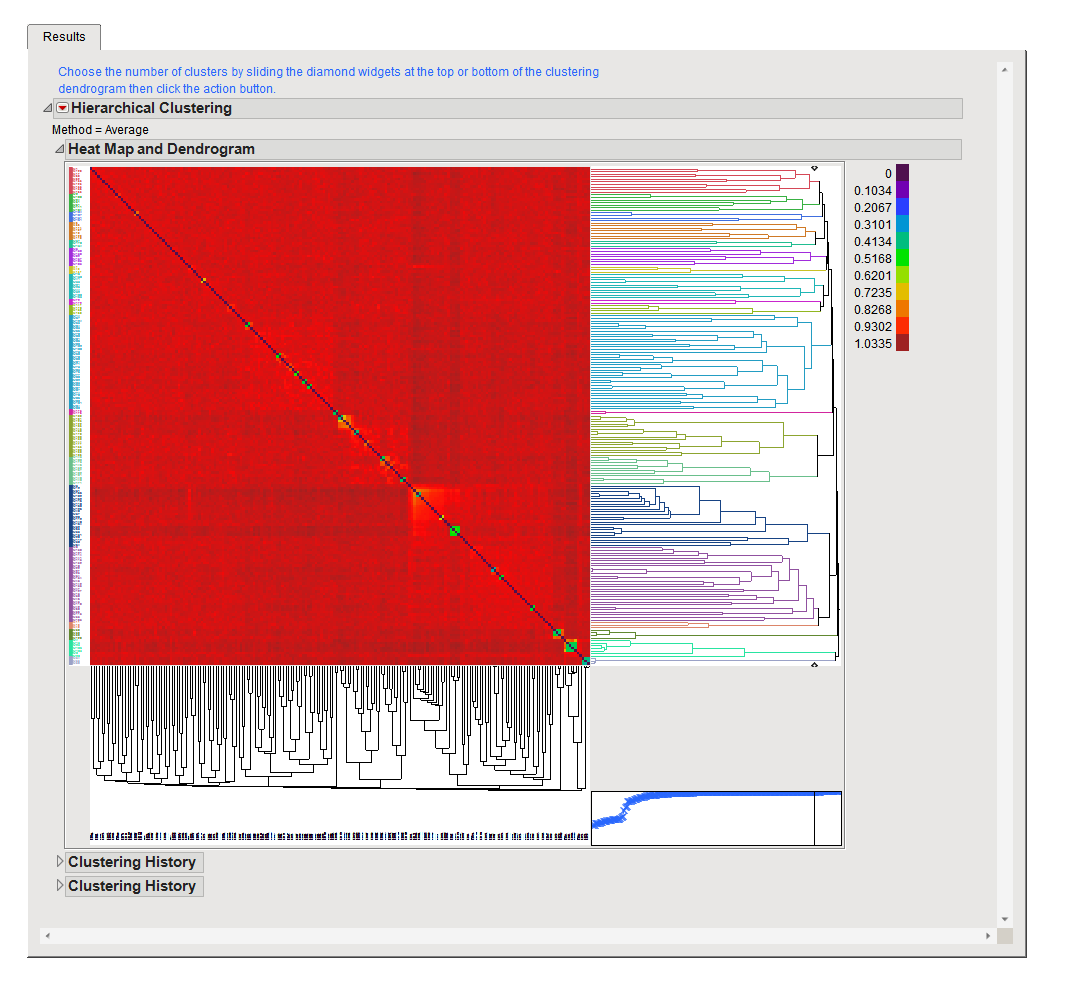
When run using the Interactive compression method, the Results tab displays the full K matrix of relatedness between samples with a heat map and dendrogram. Based on the structure (shown best by patterns in the colored heat map), you can choose to cluster the samples into groups using diamond widget tool with the dendrogram on the right. Once you have set the desired level of clustering, click to compute the aggregated estimate of relatedness and produce the compressed matrix for the samples in the groups defined by the clustering algorithm.
As shown above, data used in this example shows very little structure in the data except for small sets of more tightly related samples (shown by the small color changes along the diagonal in the plot). This corroborates the level of compression found by the Optimized method and fits well with what is known about the relationships of the individuals in this study data.
A Results tab is not generated when this process is run using the Automated compression method. Instead of a Results tab, a window is launched containing a link to the computed compressed K Matrix data set (with suffix _kc) that can be used in the Q-K Mixed Model process.