The Results tab is shown below:
The Results tab contains the following elements:
|
•
|
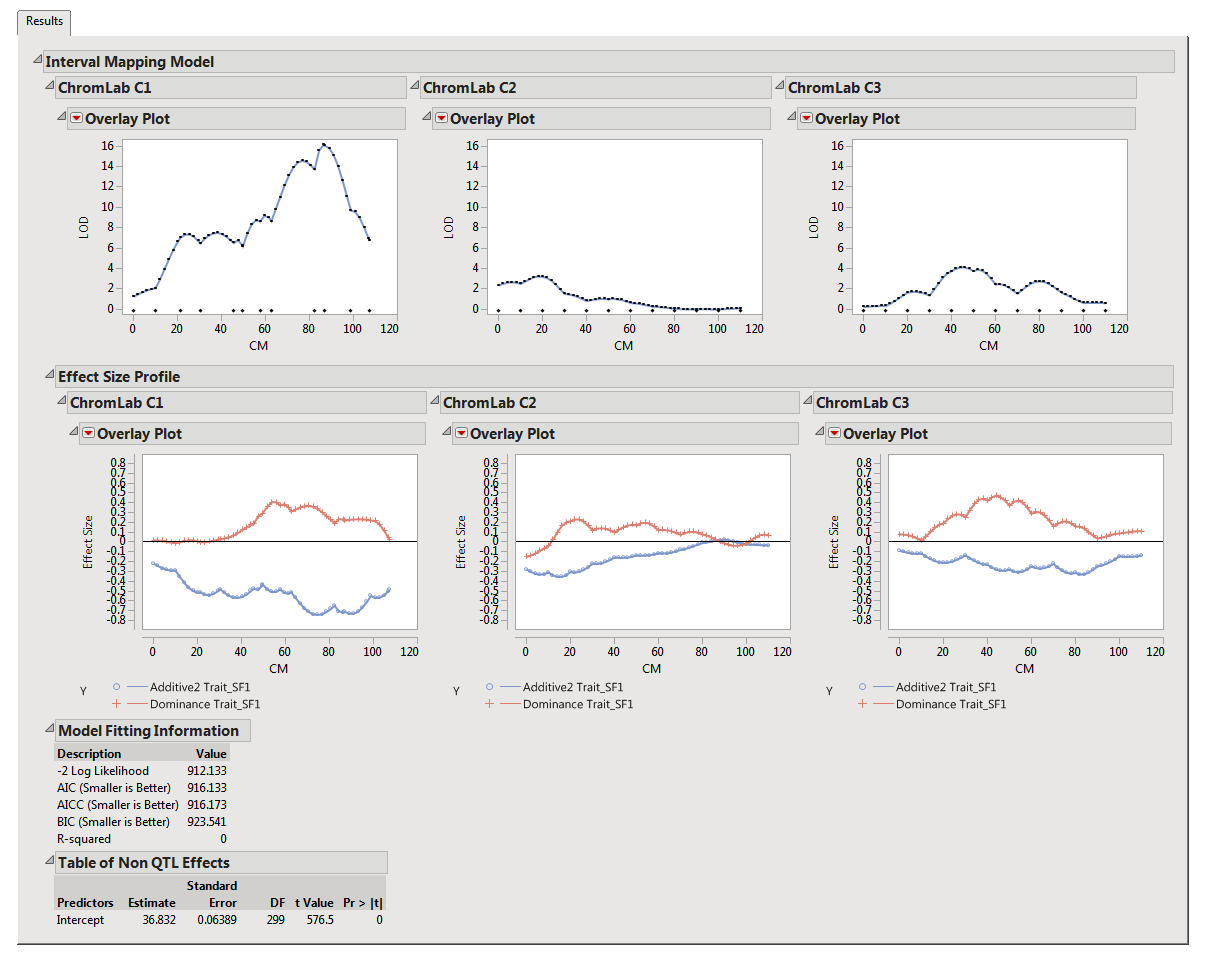
These Overlay Plots show the computed LOD score and Effect Size (on the y-axis) versus the QTL testing location (on the x-axis, measured in centiMorgans or Morgans) for each chromosome/linkage group.
Black diamonds and upside-down read triangles near the x-axis in the LOD score plot indicate the position of markers and mapped QTL, respectively, and they are displayed when the option to Display markers and Display QTL location, respectively, have been checked in the Options tab from the QTL IM, CIM and MIM Analysis application process.
This tab also shows tables of Model Fit Information (-log2 Likelihood, AIC, AICc, BIC, and R-squared), Table of Mapped QTL, Table of QTL Effects, and Table of Non-QTL Effects (effects of covariates other than QTL that might be present in the model).