Output | Genetics | Summary Chart (Rare Variant Association)

Summary Chart (Rare Variant Association)
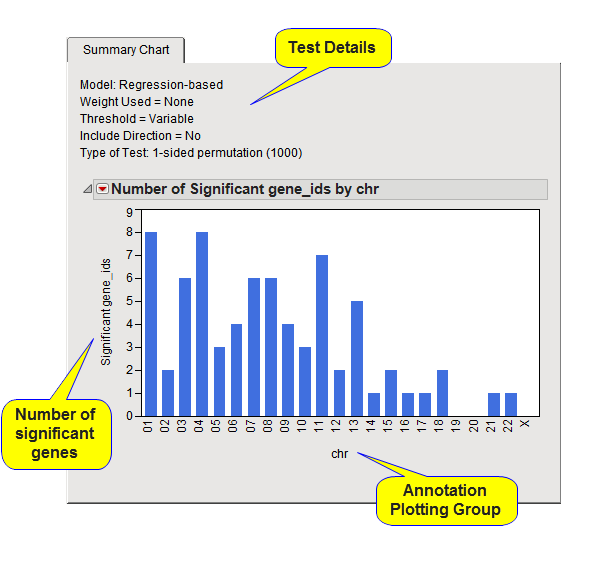
The Summary Chart tab (shown below) displays the number of significant annotation analysis groups (typically genes) in each annotation plotting group for the test performed when there are multiple annotation plotting groups (chromosomes, for example).
Details about the test performed are shown above the chart. There is a separate bar for each annotation plotting group. This tab is open by default.
This chart can be used to determine what Annotation Plotting Group Results tab to open and further explore.