The Intensity Parallel Plots tab is shown below:
The Intensity Parallel Plots tab contains the following elements:
|
•
|
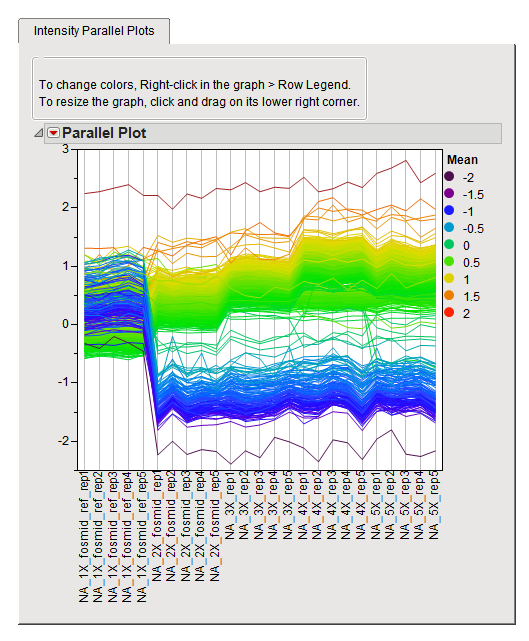
A Parallel Plot of the intensities.
|
Each profile in the plot represents one row from the tall data table. You can select profiles/rows by clicking on them. Each profile is colored according to its mean value. You can study the profiles to observe their patterns and look for potential outliers.