Additional Example of Model Comparison
|
1.
|
Select Analyze > Fit Model.
|
|
2.
|
|
3.
|
Select the following columns and click Add: Country, Weight, Turning Cycle, Displacement, and Horsepower.
|
|
4.
|
Click Run.
|
|
5.
|
Save the prediction formulas to columns by selecting Save Probability Formula from the Nominal Logistic red triangle menu.
|
|
1.
|
Select Analyze > Predictive Modeling > Partition.
|
|
2.
|
|
3.
|
Select the Country, Weight, Turning Cycle, Displacement, and Horsepower columns and click X, Factor.
|
|
4.
|
Make sure that Decision Tree is selected in the Method list.
|
|
5.
|
Click OK.
|
|
6.
|
Click Split 10 times.
|
|
7.
|
Save the prediction formulas to columns by selecting Save Columns > Save Prediction Formula from the Partition red triangle menu.
|
|
1.
|
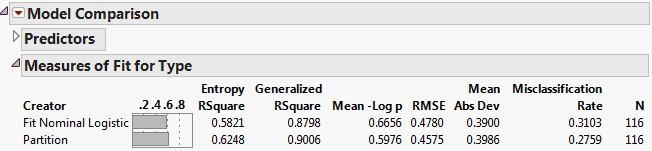
Select Analyze > Predictive Modeling > Model Comparison.
|
|
2.
|
|
3.
|
Click OK.
|
|
4.
|
Select ROC Curve from the Model Comparison red triangle menu.
|
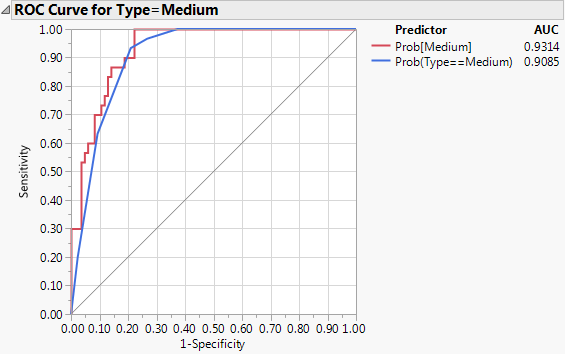
|
5.
|
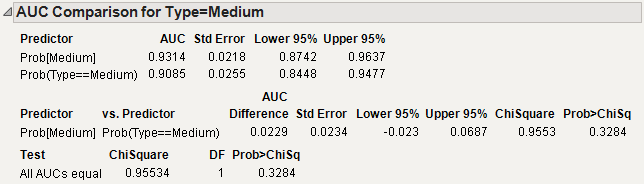
Select AUC Comparison from the Model Comparison red triangle menu.
|