The Alias Matrix addresses the issue of how terms that are not included in the model affect the estimation of the model terms, if they are indeed active. In the Alias Terms outline, you list potentially active effects that are not in your assumed model but that might bias the estimates of model terms. The Alias Matrix entries represent the degree of bias imparted to model parameters by the Alias Terms effects. See Alias Terms.
For details on how the Alias Matrix is computed, see The Alias Matrix in Technical Details. See also Lekivetz, R. (2014).
Consider the Coffee Data.jmp sample data table, located in the Design Experiment folder. The design assumes a main effects model. You can see this by running the Model script in the data table. Consequently, in the Evaluate Design window’s Model outline, only the Intercept and five main effects appear. The Alias Terms outline contains the two-way interactions. The Alias Matrix is shown in Alias Matrix for Coffee Data.jmp.
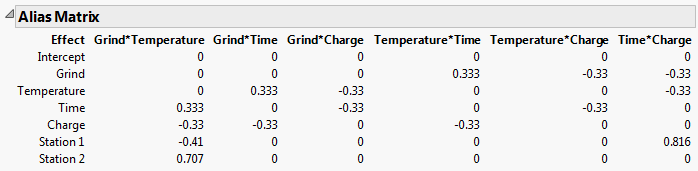
The Alias Matrix shows the Model terms in the first column defining the rows. The two-way interactions in the Alias Terms are listed across the top, defining the columns. Consider the model effect Temperature for example. If the Grind*Time interaction is the only active two-way interaction, the estimate for the coefficient of Temperature is biased by 0.333 times the true value of the Grind*Time effect. If other interactions are active, then the value in the Alias Matrix indicates the additional amount of bias incurred by the Temperature coefficient estimate.
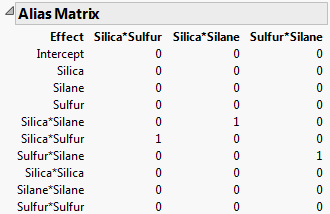
Consider the Bounce Data.jmp sample data table, located in the Design Experiment folder. The Model script contains all two-way interactions. Consequently, the Evaluate Design window shows all main effects and two-way interactions in the Model outline. The three two-way interactions are automatically added to the list of Alias Terms. Therefore, the Alias Matrix shows a column for each of these three interactions (Alias Matrix for Bounce Data.jmp). Notice that the only non-zero entries in the alias matrix correspond to the bias impact of the two-way interactions on themselves. These entries are 1s, which is expected because the two-way interactions are already in the model.