 Analysis of Bootstrap Results
|
•
|
If your analysis produced a stacked bootstrap results table, select Analyze > Distribution and assign the columns of interest to the appropriate roles. In most cases, it is appropriate to assign the column that corresponds to the first column in the report table to the By role.
|
The Distribution platform provides summary statistics for your bootstrap results. It also produces a Bootstrap Confidence Limits report for any table that contains a BootID• column (Bootstrap Confidence Limits Report).
|
•
|
The Quantiles report provides percentile intervals. For example, to construct a 95% confidence interval using the percentile method, use the 2.5% and 97.5% quantiles as the interval bounds.
|
|
•
|
The Bootstrap Confidence Limits report provides bias-corrected percentile intervals. The report shows intervals with 95%, 90%, 80%, and 50% coverage levels. The BC Lower and BC Upper columns show the lower and upper endpoints, respectively. For more information about the computation of the bias-corrected percentile intervals, see Bias-Corrected Percentile Intervals.
|
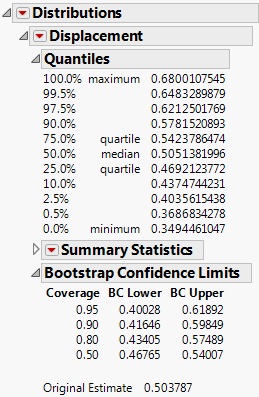
The Original Estimate at the bottom of the Bootstrap Confidence Limits report is the estimate of the statistic using the original data.
For more information about interpreting the Bootstrap Confidence Limits report, see Overview of Bootstrapping. Efron (1981) describes the methods for both the percentile interval and the bias-corrected percentile interval.