
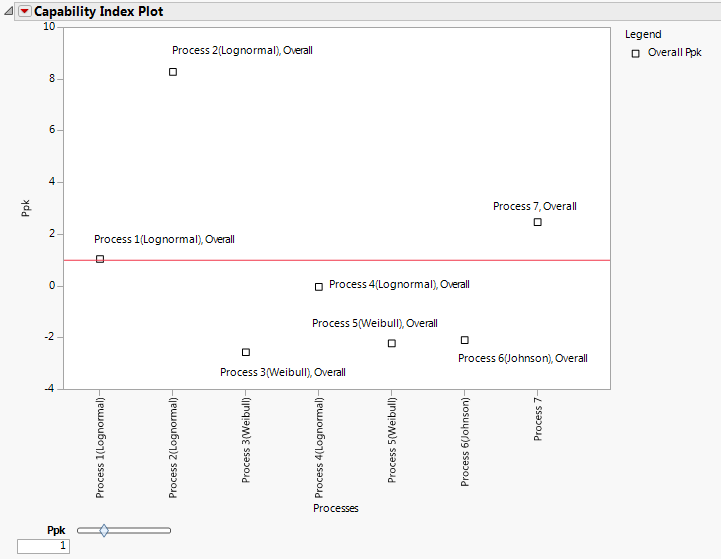
Capability Index Plot with Nonnormal Distributions shows a Capability Index Plot report for the Process Measurements.jmp sample data table. Seven of the variables are fit with nonnormal distributions. Process 7 is fit with a normal distribution. Points have been labeled using the Label Overall Sigma Points option that is available in the Capability Index Plot red triangle menu.
Shows or hides the Ppk level shading. When you select Shade Levels, shaded areas appear in the plot. The shaded areas are described as follows, with p representing the value shown in the box beneath Ppk:
|
–
|
|
–
|
Points in the green area have 2p < Ppk.
|