To produce the plot shown in Example of a Contingency Table, follow the instructions in Example of Contingency Analysis.
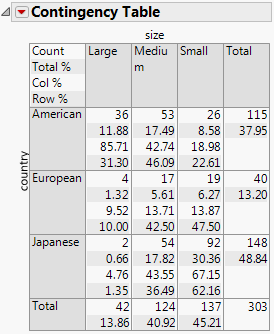
For example, in Example of a Contingency Table, focus on the cars that are large and come from America. The following table explains the conclusions that you can make about these cars using the Contingency Table.
|
Percentage of all cars that are both large and come from America (36/303)1.
|
||
|
Percentage of large cars that come from America (36/42)2
|
||
|
Percentage of American cars that are large (36/115)3.
|
||