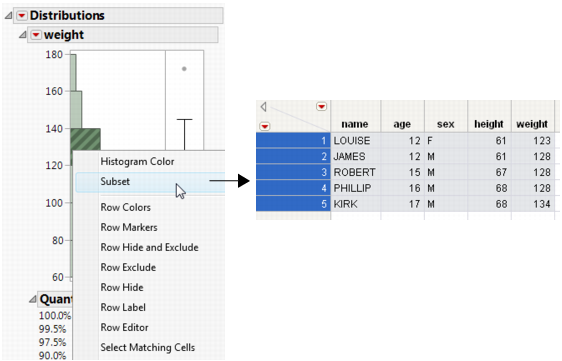
Once you have produced output that contains a histogram (by selecting Analyze > Distribution), you can use the histogram to create a new data table. The new data table contains the data in the histogram’s highlighted bars.
To create a subset, double-click a highlighted bar. Or, right-click anywhere in the histogram and select Subset from the menu. The subset table appears, as shown in Subset Created from a Histogram.
Once you have produced output that contains a Pareto Plot (by selecting Analyze > Quality and Process > Pareto Plot), you can use the Pareto Plot to create a new data table. The new data table contains the data in the Pareto Plot’s highlighted bars. To create a subset, double-click a highlighted bar.