Shows the Differencing Specification window, shown in Differencing Specification Window. The window enables you to specify the differencing operation that you want to apply to the time series. Differencing the values in a time series can transform a nonstationary series into a stationary series. The differenced series is given by the following equation:
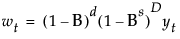
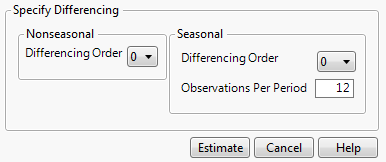
The Differencing Specification window enables you to specify the Nonseasonal Differencing Order, d, the Seasonal Differencing Order, D, and the number of Observations per Period, s. Selecting zero for the value of the differencing order is equivalent to no differencing of that kind. Each time you specify a differencing operation and click Estimate, a new Difference Report is displayed in the report window. For more information, see Additional Example of the Time Series Platform.
Estimates the linear trend of the time series using a linear regression model and removes the linear trend from the data. A Time Series report for the detrended series is added to the report window, along with the linear trend information. See The Time Series Analysis Report and Linear Trend Report.
Estimates the cyclic component of a time series using a single cosine wave and then removes the cyclic component from the data. When you select the Remove Cycle option, the Define Cycle dialog appears. This dialog window enables you to specify the number of units per cycle and indicate whether a constant should be subtracted from the data. A Time Series report for the decycled series is added to the report window, along with the cycle information. See The Time Series Analysis Report and Cycle Report.
Removes trend and seasonal effects using the X-11 method developed by the US Bureau of the Census (Shiskin et. al., 1967). For details about the X-11 method, see Statistical Details for X-11 Decomposition. When selected, the Select Decomposition Type dialog appears. This dialog window enables you to specify a multiplicative or additive X-11 adjustment. Once you click OK, an X11 report is added to the report window. See X11 Report.
The X11 option is available only for monthly or quarterly data. The X, Time ID column must contain numeric values equally spaced by month or quarter without any gaps or missing values. JMP returns an error if you request X11 for a time column that does not satisfy these requirements.
Note: When you select the Remove Linear Trend or the Remove Cycle options, JMP adds a column to the data table that contains the detrended or decycled data. If this column is already present in the data table when you select the option, JMP overwrites the existing column.
Shows or hides a plot with observations at time t on the y-axis and observations at time t +/- p on the x-axis. The +/- p is known as the lag. This plot is useful in determining how an observation at time t is related to another observation at time t +/- p. If there is not an identifiable structure to the plot, the observations are not related. However, if there is a structure to the plot, this indicates that there is some relationship between observations across time. Identifying the structure helps when building a time series model.
 . The plot includes plots of the output series versus all input series, in both numerical and graphical forms. The blue lines indicate two standard errors.