For this example, you have constructed a definitive screening design to determine which of six factors have an effect on the yield of an extraction process. The data are given in the Extraction Data.jmp sample data table, located in the Design Experiment folder. Because the design is a definitive screening design, each factor has three levels. See the Definitive Screening Designs topic.
Although the experiment studies six factors, effect sparsity suggests that only a small subset of factors is active. Consequently, you feel comfortable investigating power in a model based on a smaller number of factors. Also, past studies on a related process provide strong evidence to suggest that three of the factors, Propanol, Butanol, and pH, have negligible main effects, do not interact with other factors, and do not have quadratic effects. This leads you to believe that the likely model contains main, interaction, and quadratic effects only for Methanol, Ethanol, and Time. You decide to investigate power in the context of a three-factor response surface model.
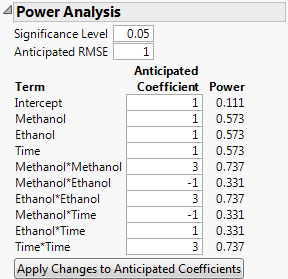
Use the Evaluate Design platform to determine the power of your design to detect strong quadratic effects for Methanol, Ethanol, or Time.
|
1.
|
|
2.
|
Select DOE > Design Diagnostics > Evaluate Design.
|
|
3.
|
You can add Yield as Y, Response if you wish. But specifying the response has no effect on the properties of the design.
|
4.
|
Click OK.
|
|
5.
|
|
7.
|
|
8.
|
Click Apply Changes to Anticipated Coefficients.
|